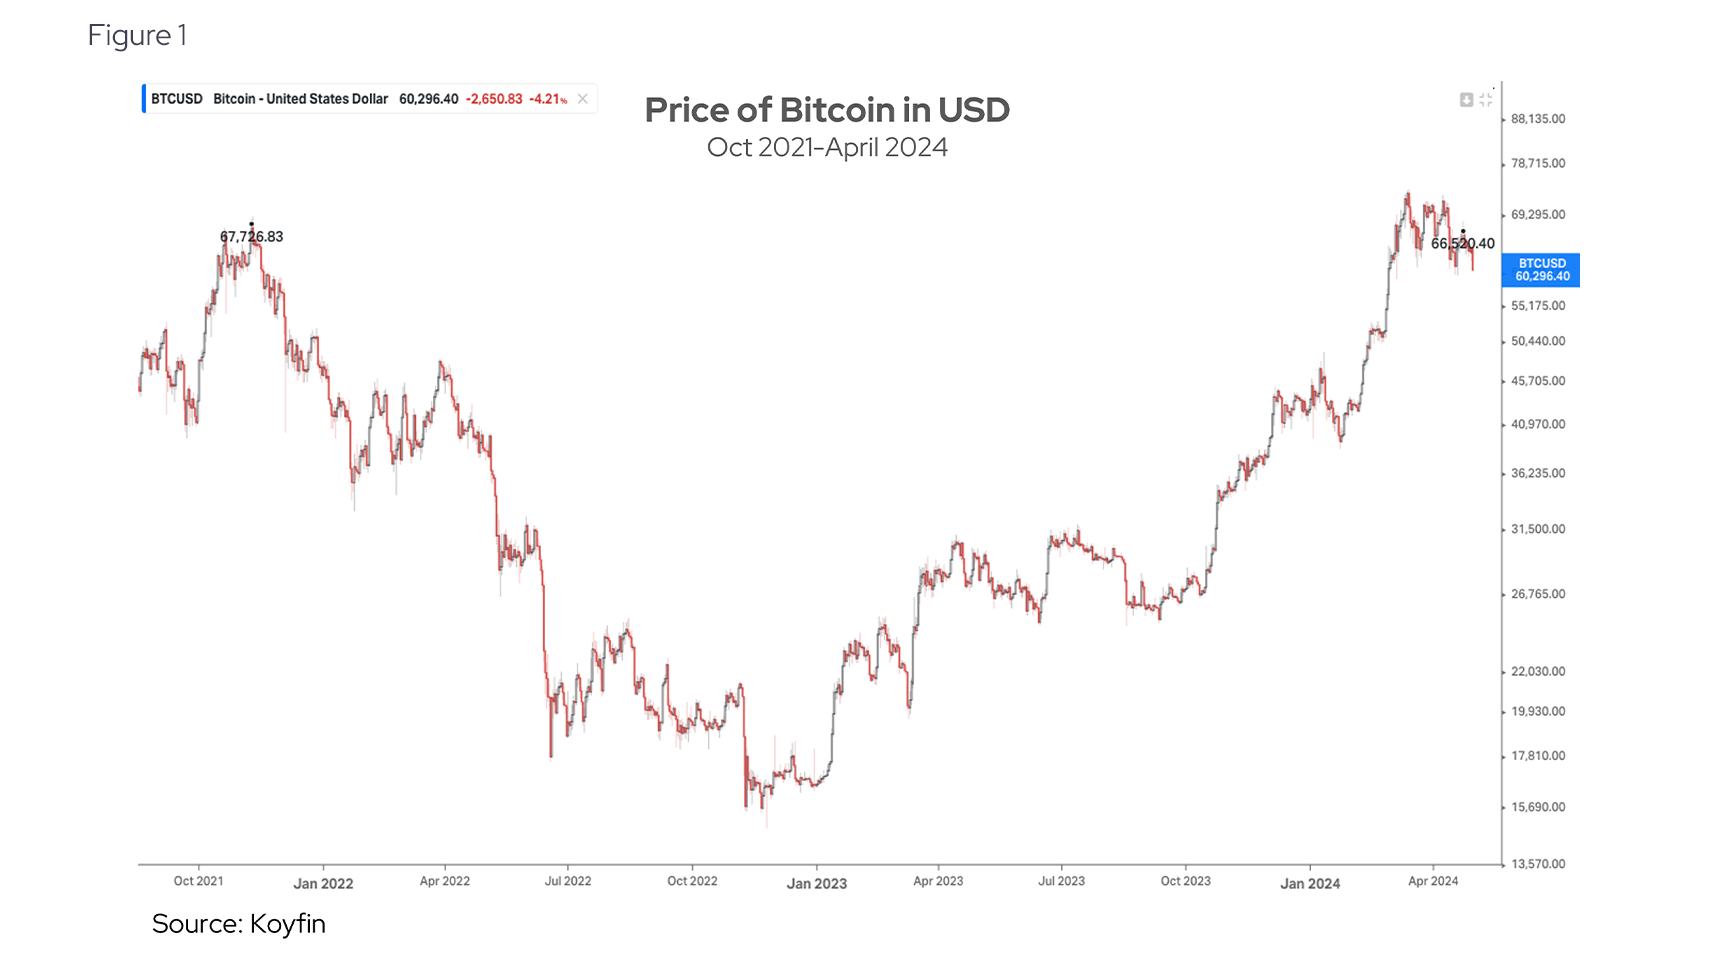
Cryptocurrencies have staged a rally since last October, reaching 2021 highs (see Figure 1) and with that rise, brought attention back to the platforms that offer investors access to the dizzying and volatile world of crypto. The total cryptocurrency market capitalization has recently reached $2.6T with half of that being, Bitcoin (BTC), the market leader, and Ethereum (ETH) at a distant second.
At the same time, the popular crypto trading platform Coinbase (COIN) and the trading app Robinhood (HOOD), both of which allow US investors to participate in a select group of cryptocurrencies, have benefited. And yet, Yodlee data along with Google Trends data points to a notable disconnect between the sharp increase in the platforms’ stock prices–which for the most part has reflected the rise in BTC spot rate–and the trends that underpin the businesses that operate these platforms.
This article examines transaction trends for two popular trading platforms, Coinbase and Robinhood, used by millions of investors participating in cryptocurrencies. These transactions are made up of deposits and platform fees including trading commissions and subscriptions through credit and debit cards. The data used in the analysis is de-identified spending data from Envestnet® | Yodlee®.
The latest crypto craze is different
Since its first transaction in 2010 where 10,000 BTC was used to purchase two pizzas, Bitcoin has seen a volatile history. In November 2021, BTCUSD (The price of a single coin in USD) spiked to just under $70k before taking a tumble that would continue into December of the following year (see Figure 1). However, since then BTCUSD has regained its momentum, rising back up to similar levels as 2021 as illustrated in Figure 1.
Focusing on the recent growth seen in BTC, consider the year-to-date (YTD) total return which closed on April 29th at 44%, as seen in Figure 2. The figure tracks the return an investor would have gained had they purchased Bitcoin on January 1st, 2024 and held it through April 29th. The figure also shows the total YTD return of both Coinbase and Robinhood as well as the S&P 500 Index (SPX) for comparison. Both COIN and HOOD were closely correlated to BTC and all three handily outperformed the general market so far this year, albeit with a lot more volatility.
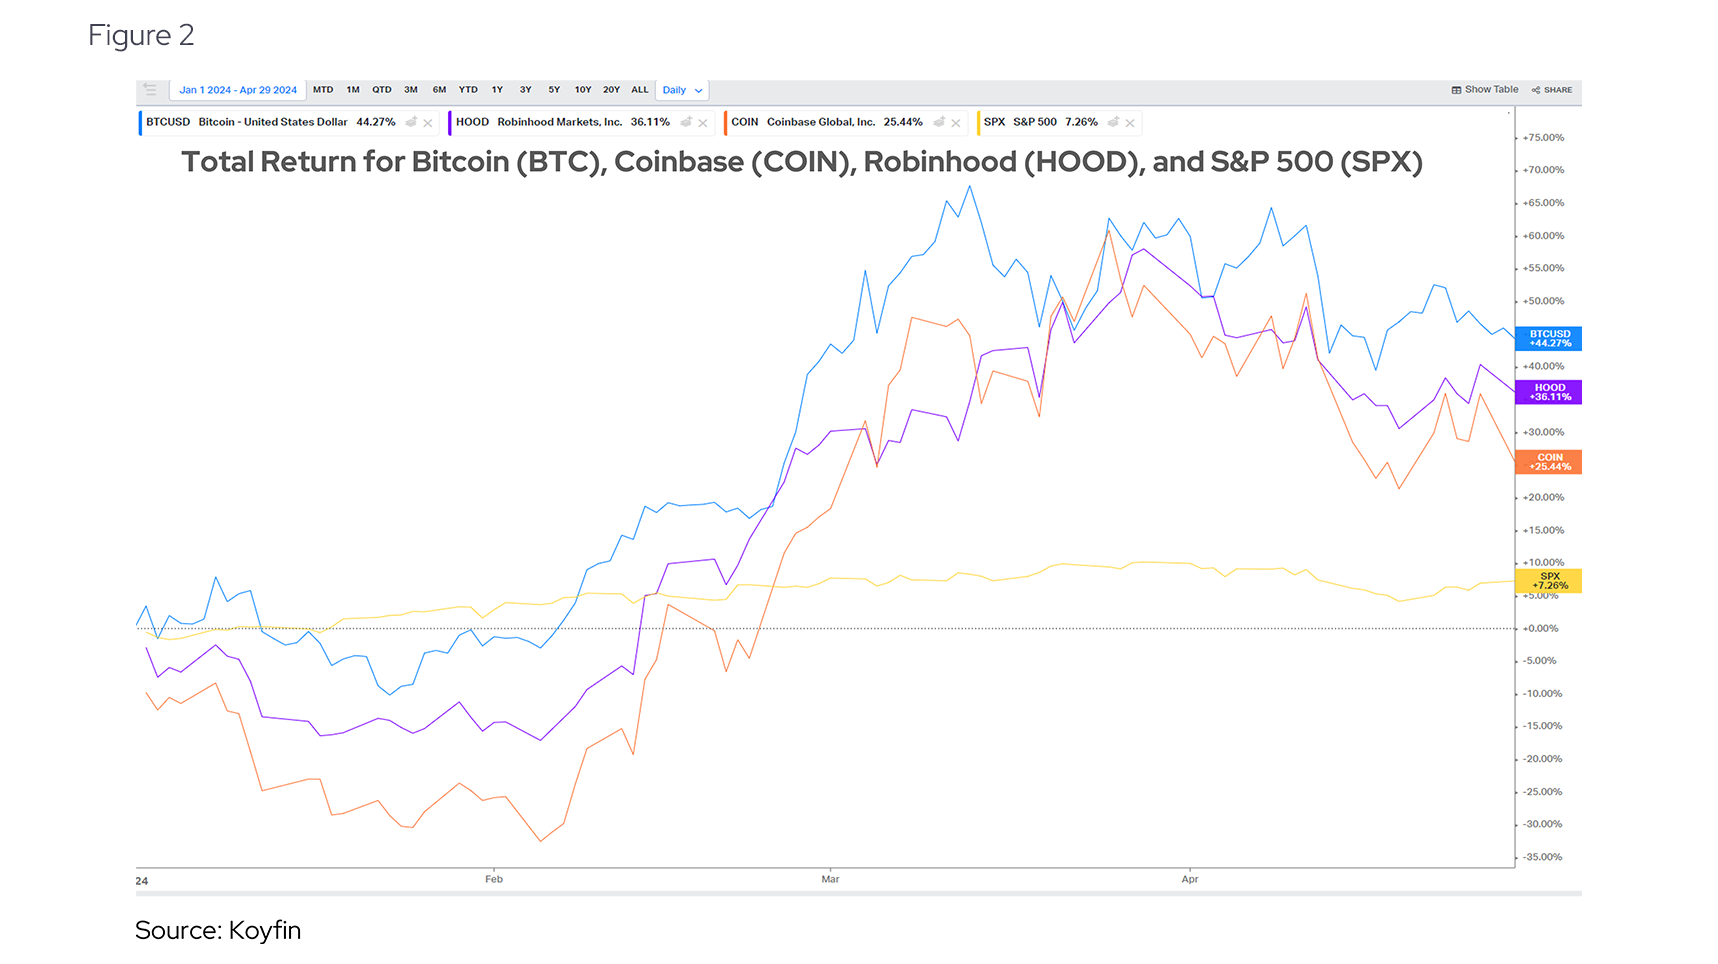
This relationship begs the question of how much the price of Bitcoin impacts the success of Coinbase, particularly given that there is no direct fundamental relationship between the platform and the asset most widely traded on it. In fact, as we will discuss below, the interest from retail investors in Bitcoin has not reached 2021 levels and the volume of retail deposits has not completely recovered. There may be another reason for the correlation –institutional interest may be playing a larger role here given the change in US regulation and the proliferation of cryptocurrency ETFs. More on this below.
Despite the surge in Bitcoin, retail interest has not reached 2021 peaks
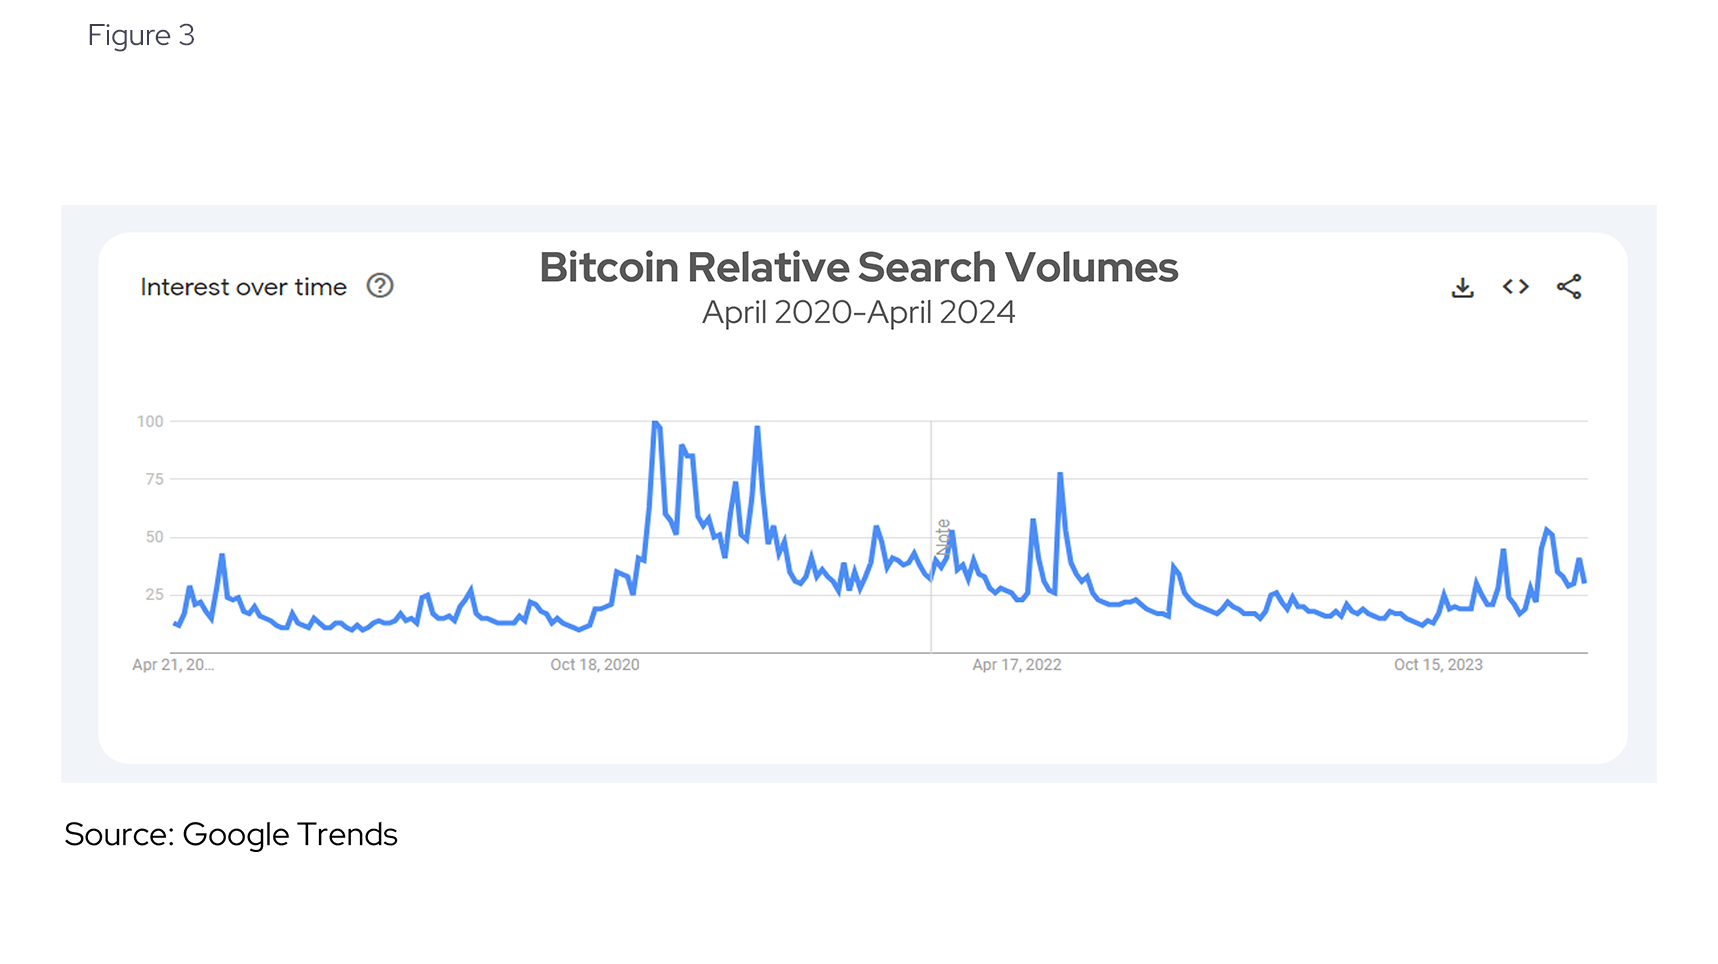
While the growth in price value of BTCUSD this year is undeniable, the retail interest in bitcoin is relatively weak - only half of what it was around the time it peaked at similar price levels in 2021. The run-up to the Bitcoin “halving” on April 19th, should have been a catalyst for public interest. Once every four years the number of new bitcoins entering circulation dops by half. The last time “block rewards”, or the number of new bitcoins entering circulation every ten minutes, halved was on May 11th, 2020. However, instead of increasing, the level of interest for the leading cryptocurrency dropped in April according to Google Trends as shown in Figure 3.
Crypto demand has other outlets, but Coinbase sees tailwinds
In addition to this, the demand that is driven by price action has several other outlets besides direct investment into BTC through Coinbase or Robinhood.
On January 10th, 2024, the Securities and Exchange Commission (SEC) approved 11 spot Bitcoin ETFs, marking a significant regulatory milestone. The new regulation allows Grayscale, iShares, and other entities rights to trade ETFs. This decision follows a lengthy period of hesitation and a pivotal court ruling criticizing the SEC's previous denial as being inconsistent. The approved ETFs will allow broader market access to Bitcoin, making it easier to invest in cryptocurrency through traditional brokerage accounts, and are expected to enhance Bitcoin's integration into regulated financial markets.
Retail proves slow to dive into crypto again as deposit growth is sluggish
Retail is a different story. Yodlee data shows that retail investors are not capturing the full run in BTCUSD this year and that while there are some positive signs of deposits picking up, they are not nearly at the same levels as before. The price of BTC may need to climb much higher and the rally last longer to attract more retail interest.
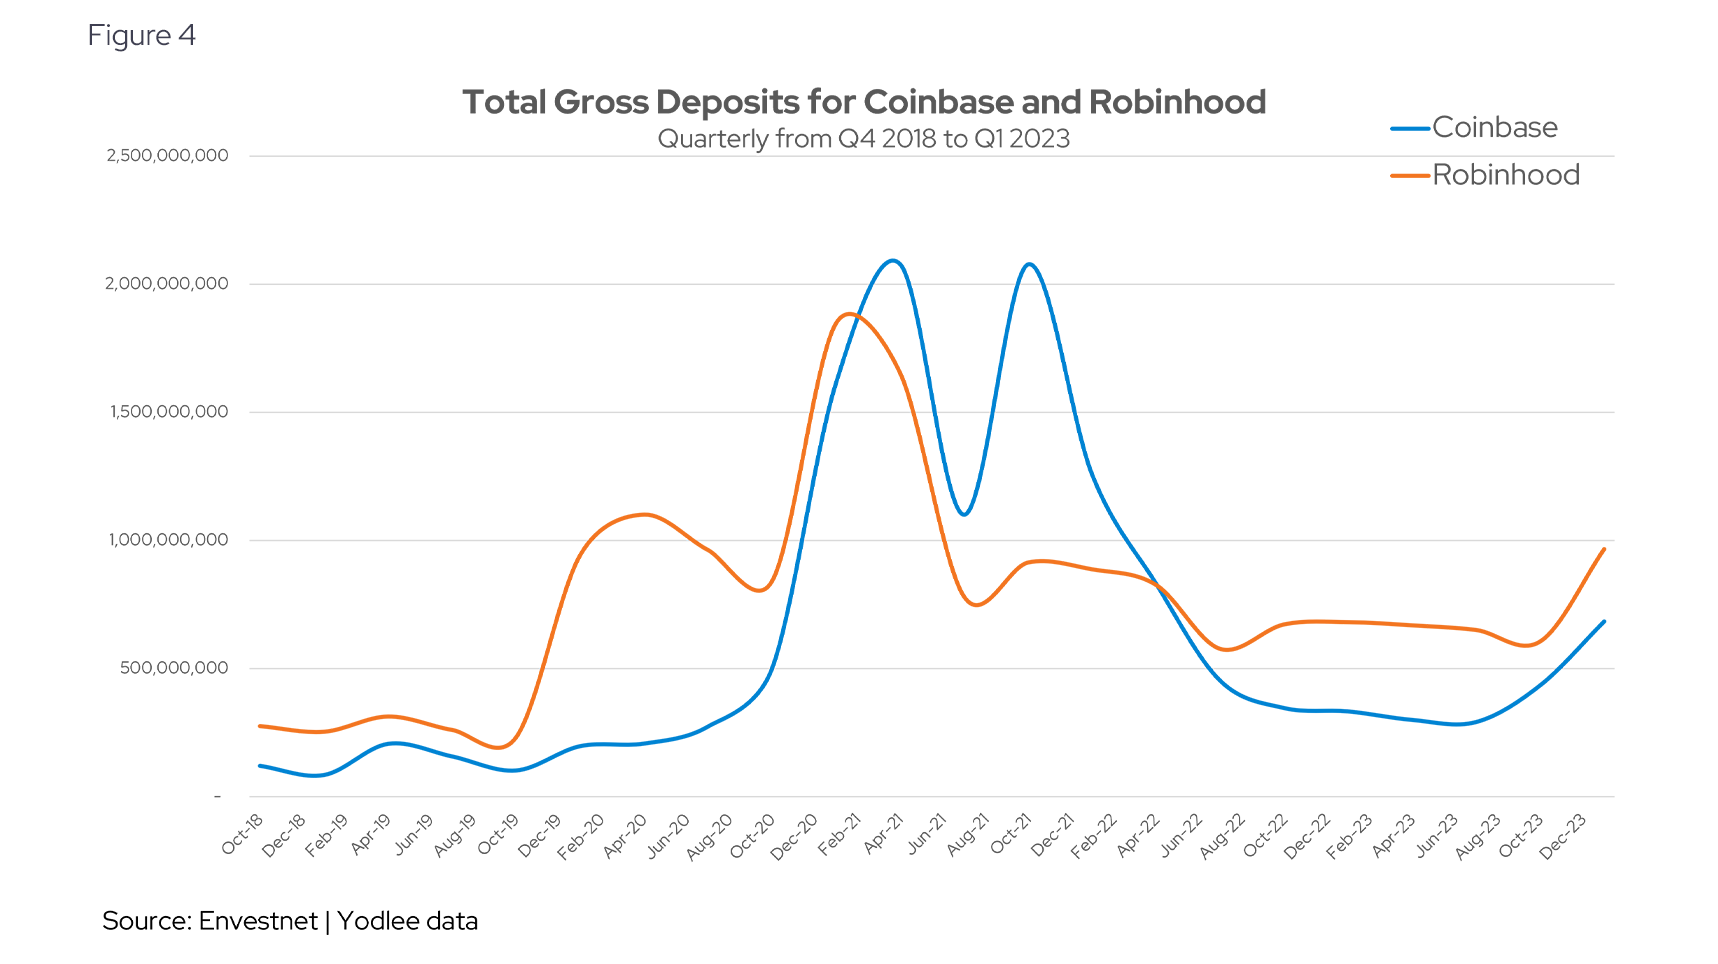
Kicking off after April 2021, Robinhood users’ deposits dropped from just over $1.8 billion and never regained momentum according to Figure 4. This compared with Coinbase users who rallied after dropping briefly from $2 billion after July 2021 running back up to April 2021 levels a full six months after Robinhood users tapered off. Following this second spike of inflows by Coinbase users, the deposits dropped significantly, showing slight signs of recovery by both platforms in late 2023.
Average deposits for Coinbase and Robinhood bounce back
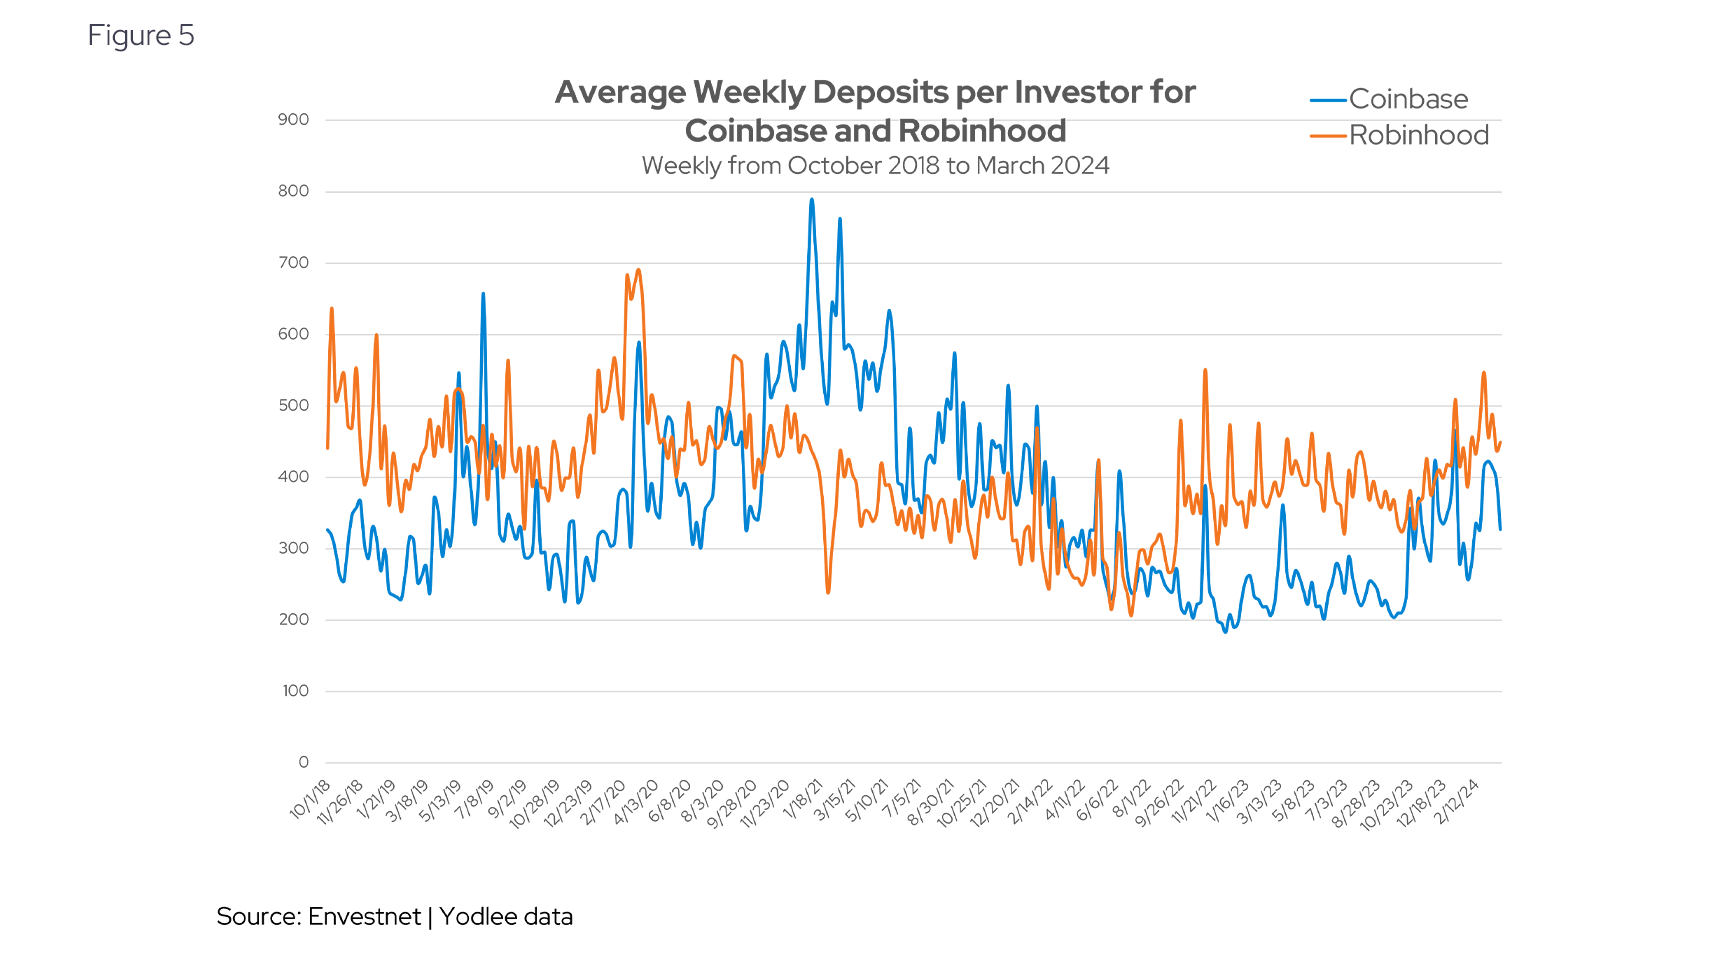
On the bright side for Coinbase and Robinhood, the average deposit amounts have stopped dropping and reversed their downward course to increase to around $400 on average (Figure 5). There may be several reasons for deposits to slowly increase. Some are related to the platforms themselves, such as promotional activity or improved features. Others may be market-led developments like the expectation of interest rate cuts, Bitcoin halving in April 2024, and the SEC’s move to allow Bitcoin ETFs in January 2024 as mentioned previously. Still, the platforms need to work on attracting new users as well as retaining existing customers as active investors.
Attracting new investors is still a challenge for platforms like Coinbase
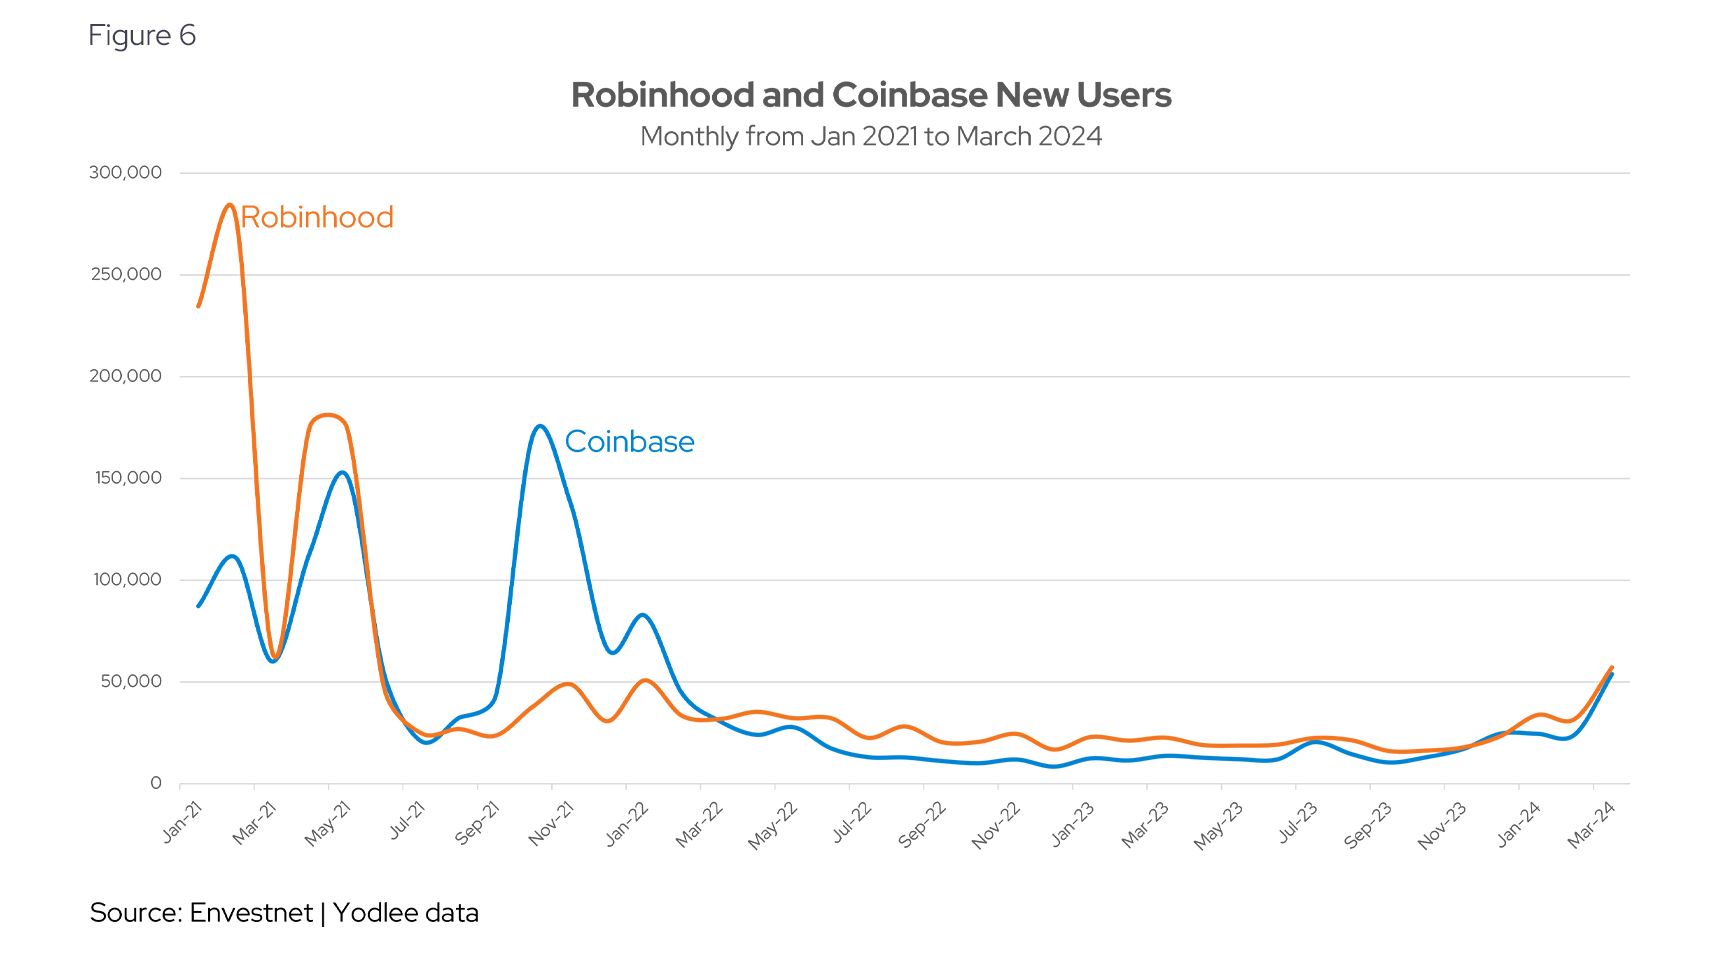
Analyzing a different cut of the data shows that new retail investors are slow to join the platforms and may be waiting for a prolonged Bitcoin bull run before getting involved en masse.
We defined “new users” as someone who made a deposit and had no transactions with the platform in the prior 12 months. The chart below, a snapshot of Yodlee’s transaction data, illustrates the hesitancy from retail investors and the lack of bounce-back from the last significant bull run in 2021, even though there are signs of a slight uptick in March.
User retention is mixed with Coinbase seeing a modest improvement from 2022
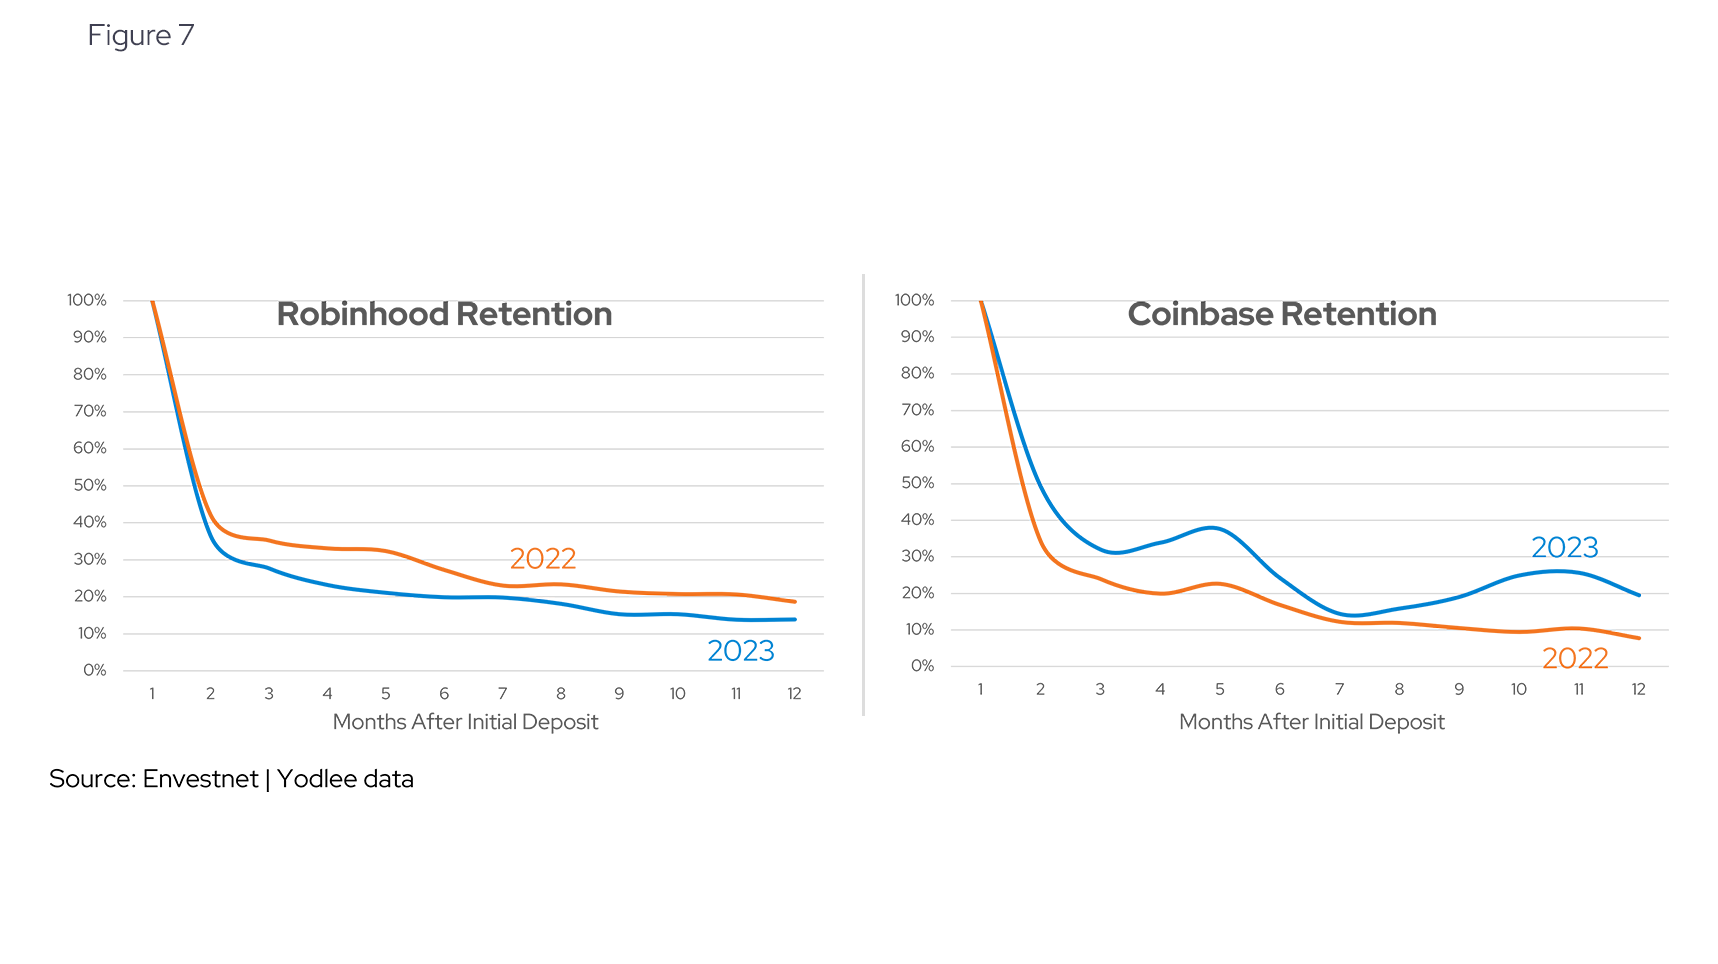
Attracting new users is challenging enough but retaining them is even more so. This is where the focus is for merchants in 2024, especially since there has been a slight improvement in deposits and transactions as shown previously. The figures below show a side-by-side view of how both platforms have shaped up in 2022 and 2023. While Coinbase has improved its retention, Robinhood has slipped down relative to the year prior.
The data reveals investor hesitation
While digital assets and cryptocurrencies remain hot topics discussed at dinner parties and on talk shows, the data shows that online interest has been relatively low, and retail investors are signaling the same with their wallets. The rally of Bitcoin has shown the strength of the cryptocurrency in increasing the price of platforms like Coinbase but according to Yodlee transaction data, retail traders are not back in full swing and waiting for a more remarkable signal before depositing their hard-earned money and buying more Bitcoin.
Want to see how transaction data can inform your investment process?
Learn more about Envestnet | Yodlee Merchant and Retail Insights and get a free demo from a sales representative.
About Envestnet Data & Analytics Income and Spending Trends
Envestnet Data & Analytics Income and Spending Trends utilize de-identified transaction data from a diverse and dynamic set of data from millions of accounts to identify patterns and context to inform spending and income trends. The trends reflect analysis and insights from the Envestnet | Yodlee data analysis team.