Coffee is a staple of American life with 73% of adults drinking at least one cup per day and 93% drinking at least one cup per week. Our data shows strong demand for coffee restaurant chains, albeit at a slower growth rate than a few years ago. While spending at coffee chains has increased over the past five years with Starbucks being the dominant player, the undercurrents shaping spending patterns are changing and are worth exploring in more detail. Starbucks, in particular, has led the industry with the largest market share but has seen growth slowing considerably in the past 18 months. Some smaller chains, while not challenging Starbucks directly, are growing and are worth keeping an eye on.
This article examines spending trends for a group of popular coffee chains as evidenced by de-identified spending data from Envestnet® | Yodlee®. Looking at transaction data from millions of accounts, we can get a view into how spending preferences are evolving in the coffee restaurant industry. In this analysis, we examined transaction data for the following brands: Biggby Coffee (non-public), Blue Bottle Coffee (non-public), Caribou Coffee (non-public), Dunkin' Donuts (non-public), Dunn Bros. Coffee (non-public), Dutch Brothers Coffee (BROS), La Columbe (non-public), Starbucks (SBUX), and Tim Hortons (non-public). We explore concepts such as seasonal spending patterns, market share dynamics, transaction frequencies, order values, and loyalty.
Coffee is loved but gets the cold shoulder in winter months
Total spending for coffee chains has increased 60% since pre-COVID levels (according to Figure 1). The increase was driven by rising prices and a higher number of people transacting at coffee chains. Interestingly, not all coffee chains experienced the same rising fortunes and in general, the number of transactions per buyer did not increase. Additionally, there were some observations about spending patterns that may seem surprising at first glance.
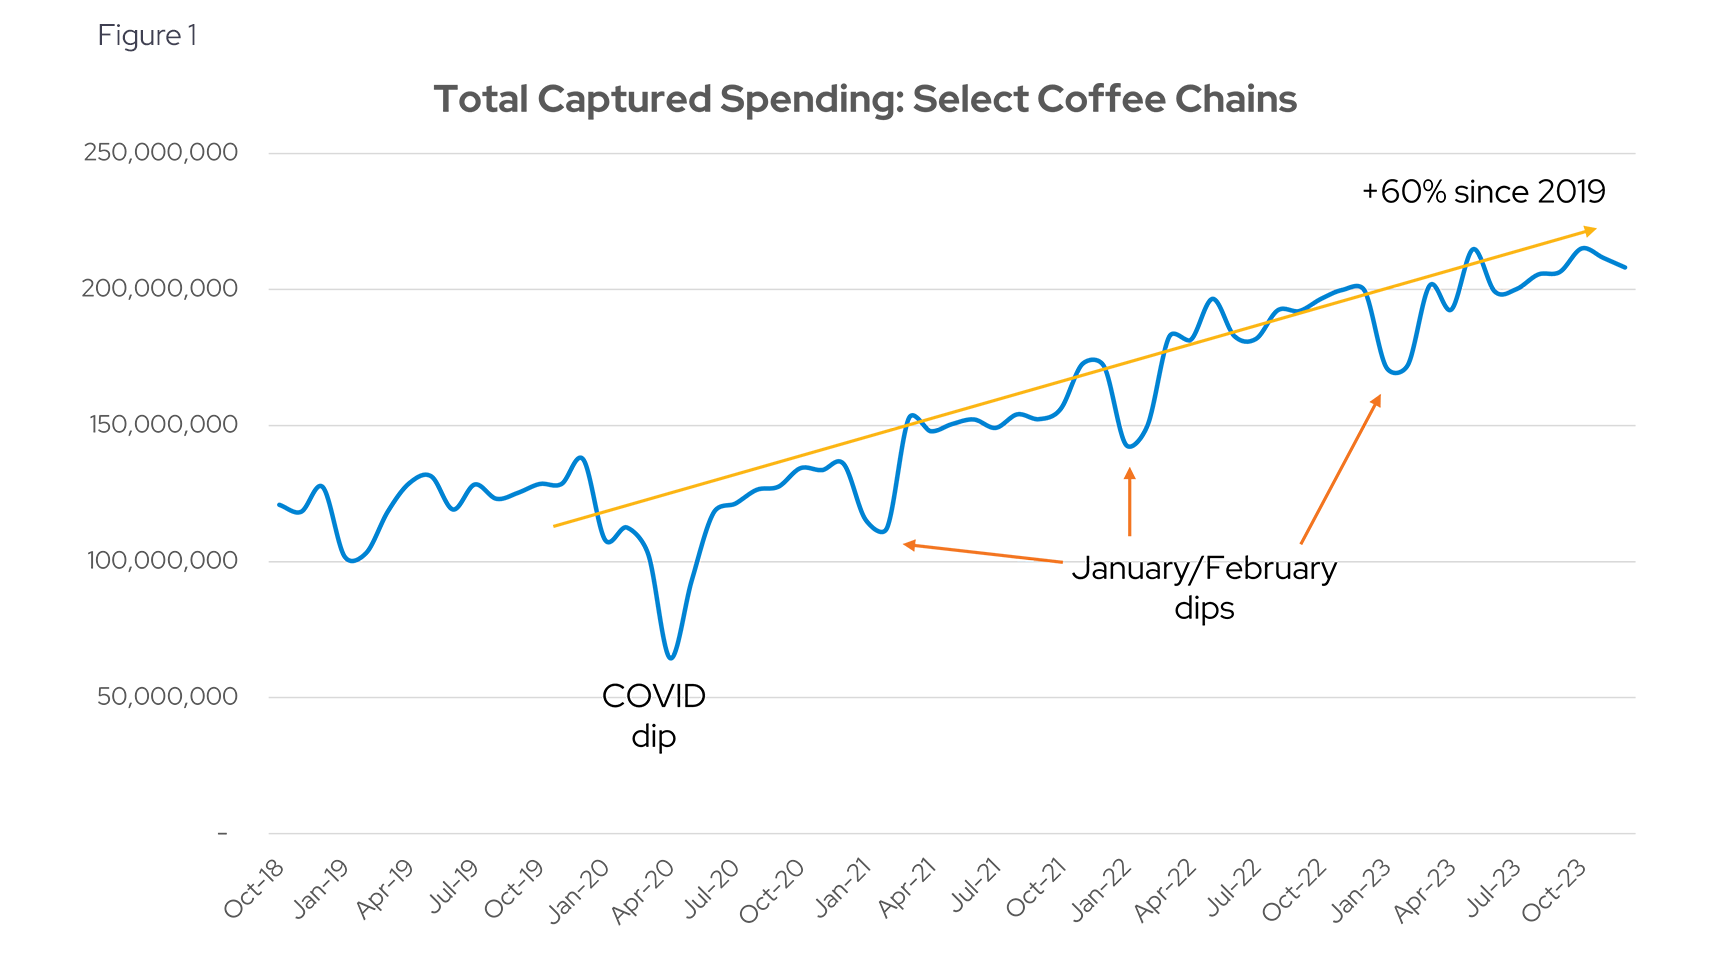
Common wisdom suggests that cold months should be great for coffee sales as people look for a cozy spot and a handwarmer on their way to work. However, our data shows the opposite with the first two months of the year being slow for coffee chains as can be seen in the January / February dips in Figure 1. Figure 2 shows the spending averages across all coffee chains by month of the year. January and February have seen 18% slower sales than the rest of the year, on average. This was true across all coffee brands we studied with data ranging from 2018 through 2023.
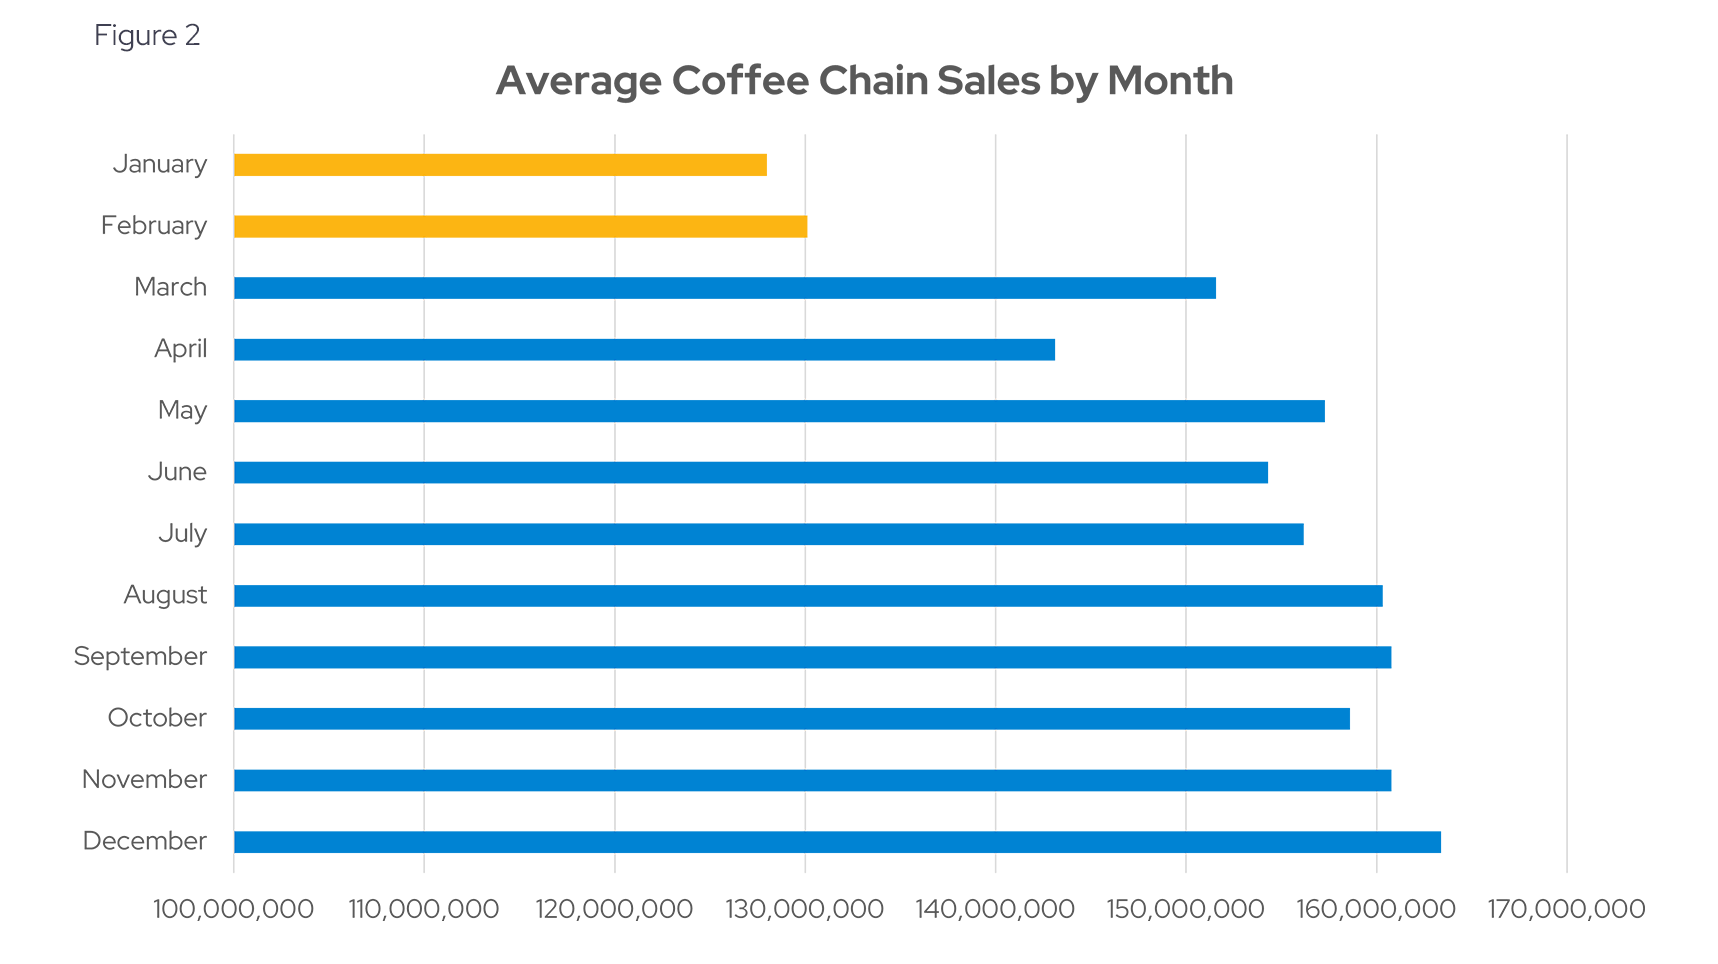
Other data confirms this finding. Some reasons for this winter slow-down could be New Year resolutions to spend less and cut down on caffeine, as evidenced by strong sales in other cold months of November and December. However, spending tends to recover by March, as can be seen in Figure 2.
America runs on coffee but it’s slowing down
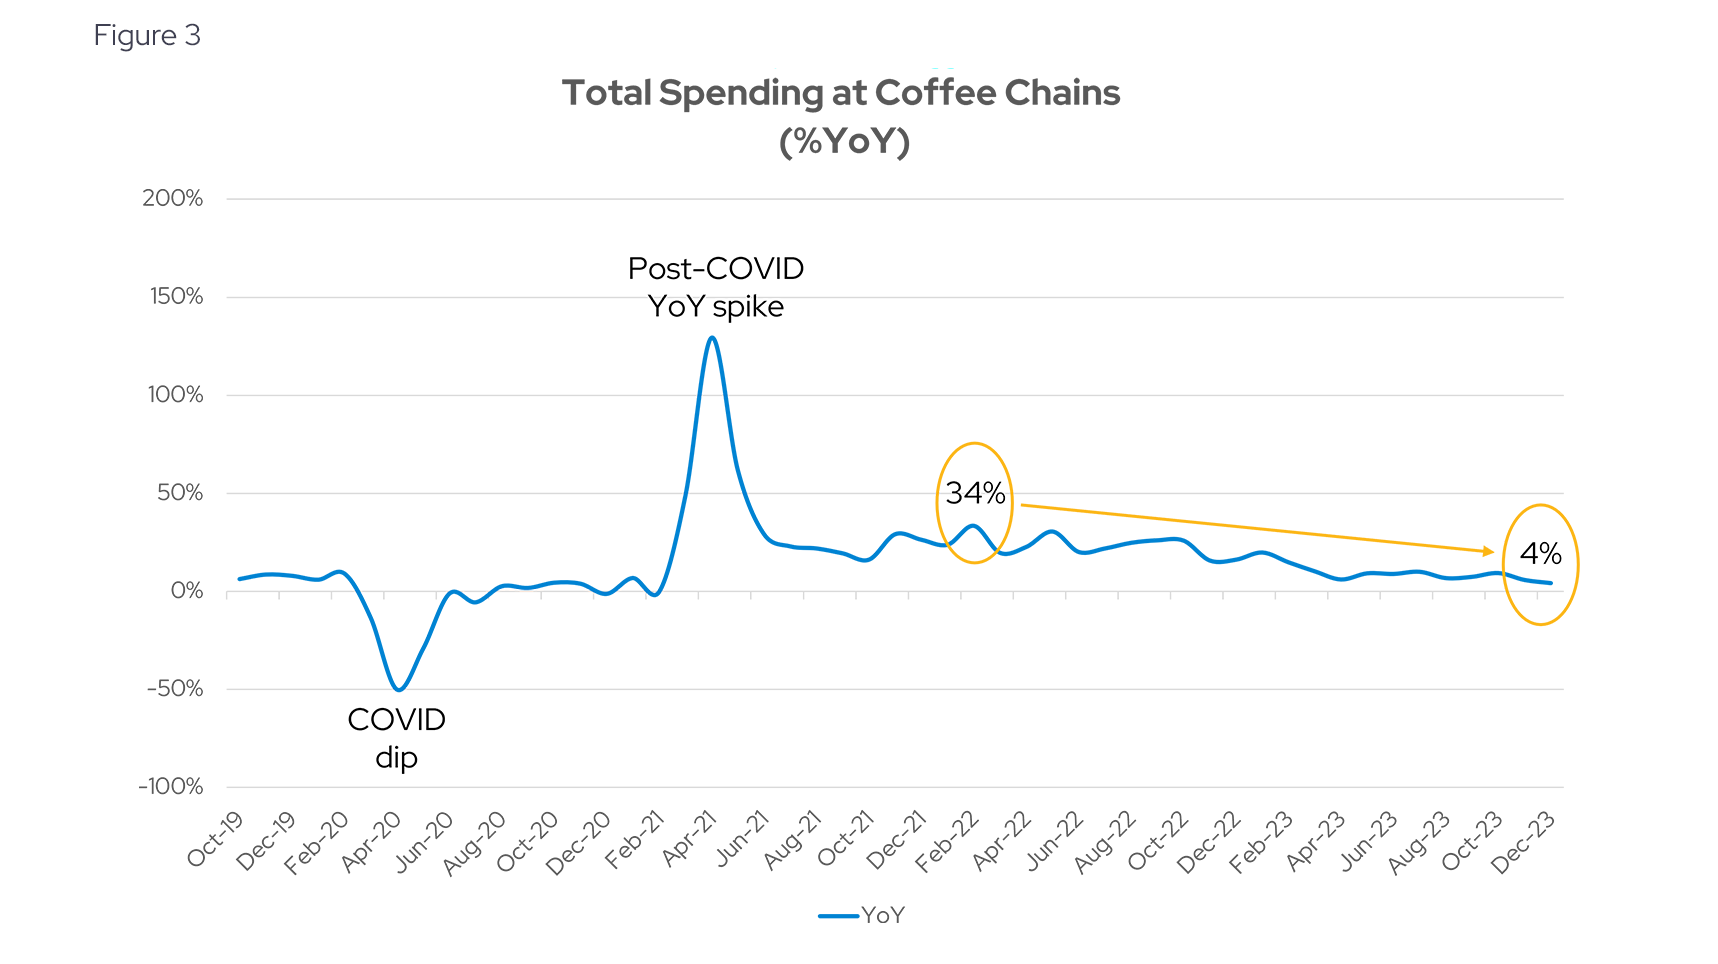
While strong spending growth persisted through 2022, it began slowing in 2023 as can be seen by the declining year-over-year (YoY) rates in Figure 3. This calculation compares total spending for each month to the same month one year ago. Growth slowed from 34% YoY in 2022 to 4% YoY as of December 2023.
To understand the root cause of this slowing growth we have to consider the factors of growth separately.
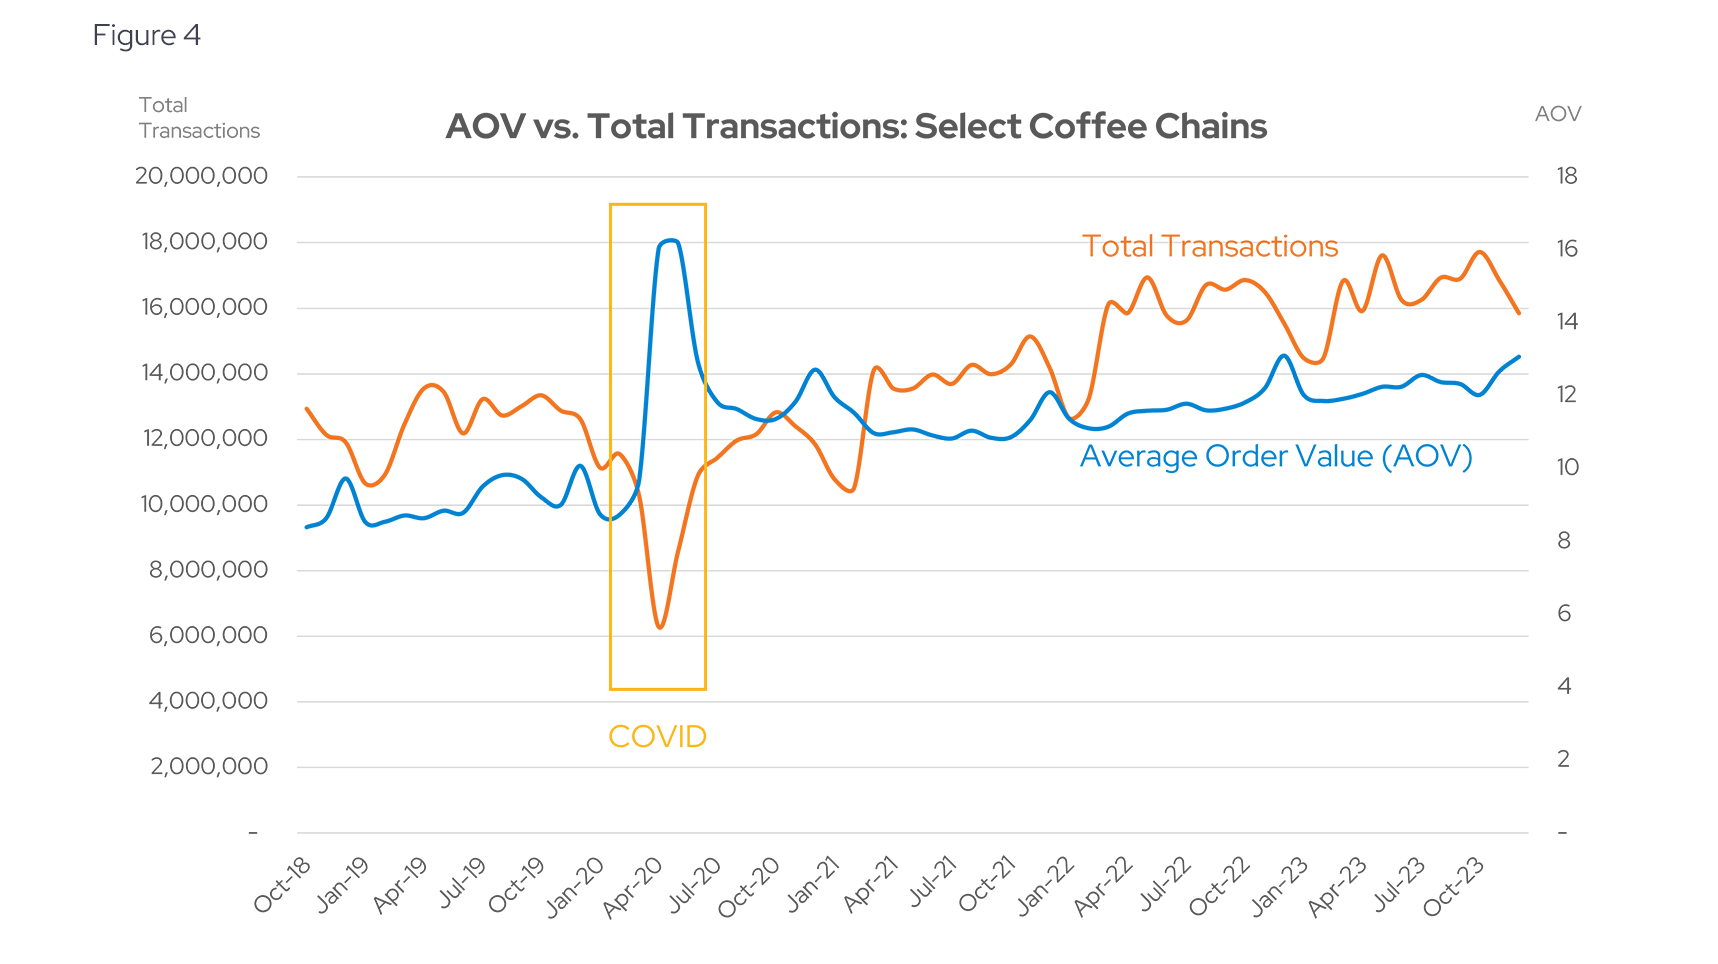
Analyzing the three possible driving forces of spending, we see that the 60% increase from 2018 was due to both rising prices (as evidenced by average order value) and new coffee drinkers drawn to chains. Figure 4 shows the total number of transactions across all coffee chains and the average order value (AOV). AOV is the average amount spent with each transaction at the chains and it increased from approximately $9 in 2018 to $13 dollars in 2023. The COVID dip in transaction numbers was partially offset by a corresponding increase in AOV, implying that purchasers chose to buy less often but spent more with each purchase during the 2020 lockdown, perhaps to minimize exposure for themselves or others.
Notably, the increase in spending was not driven by the number of coffee cups drinkers consumed daily, as the average monthly transactions per coffee drinker stayed relatively flat from 21-22 transactions per month according to Figure 5.
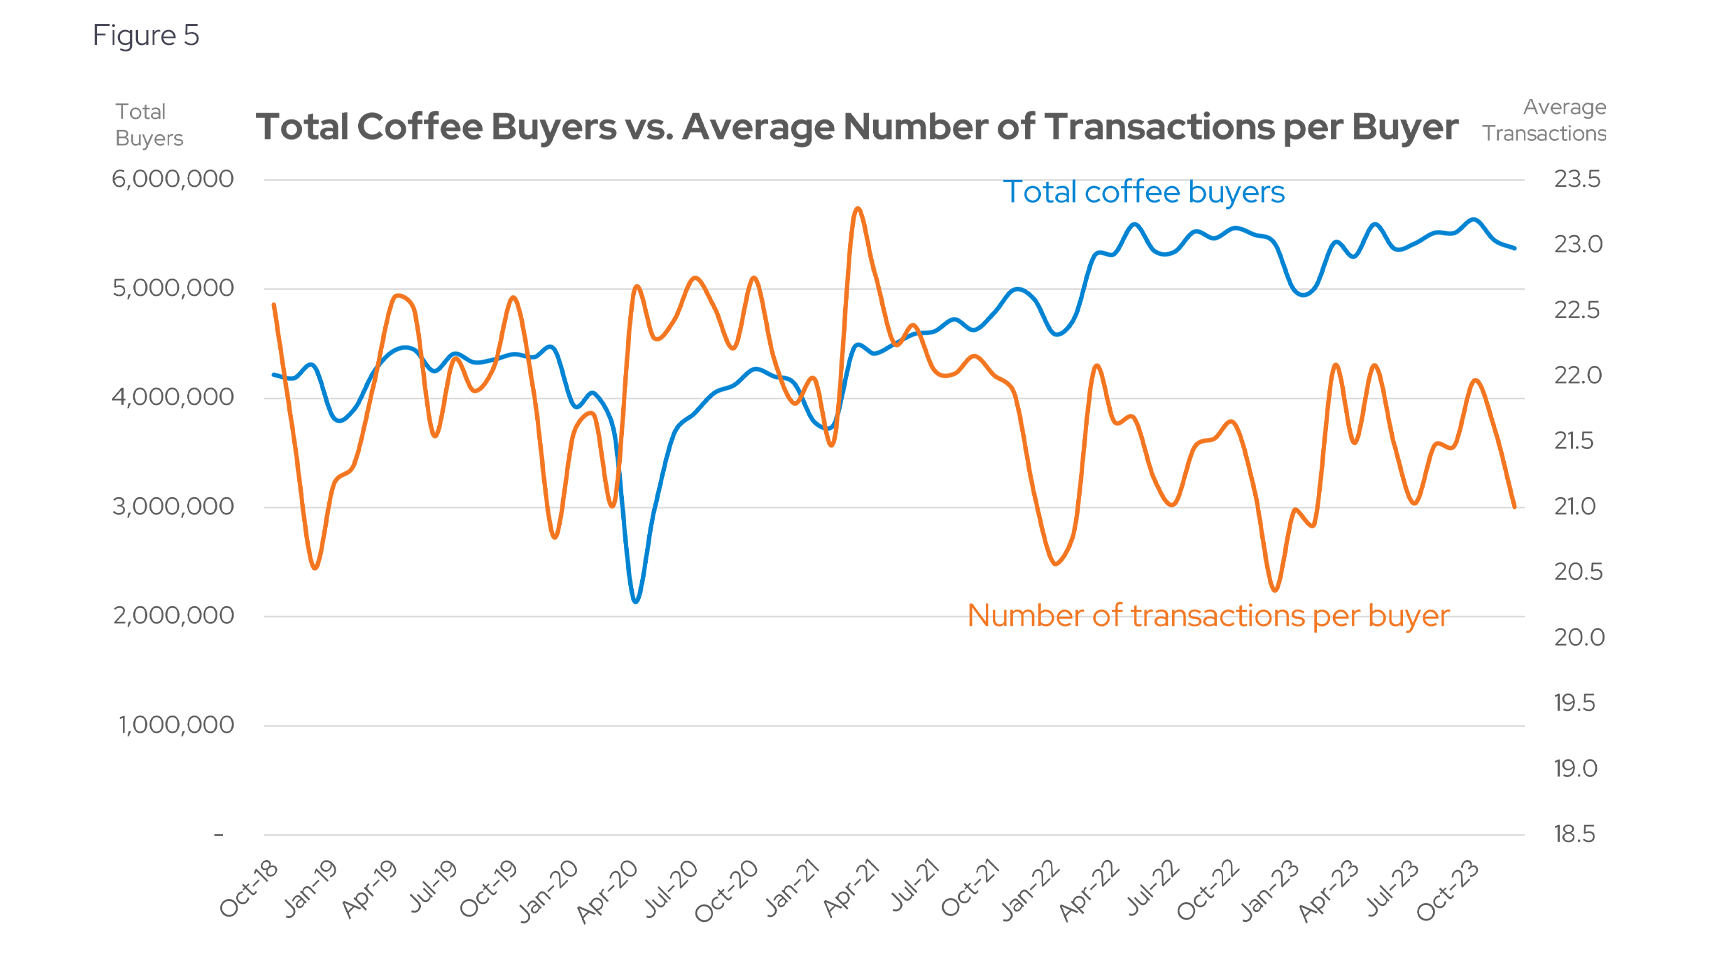
This implies that the spending growth came entirely from new coffee drinkers entering the market and spending more with each purchase, rather than buying coffee more often. And yet, both of these drivers slowed their growth rates in 2023, (see Figures 4 and 5) explaining the overall declining YoY growth.
Starbucks dominates market share but struggles to grow frequent shoppers
Starbucks controls 62% of the total spend for the group of coffee chains in our study, and has been the leader for multiple years, though it is slightly off its pre-COVID market share peak of 65%.
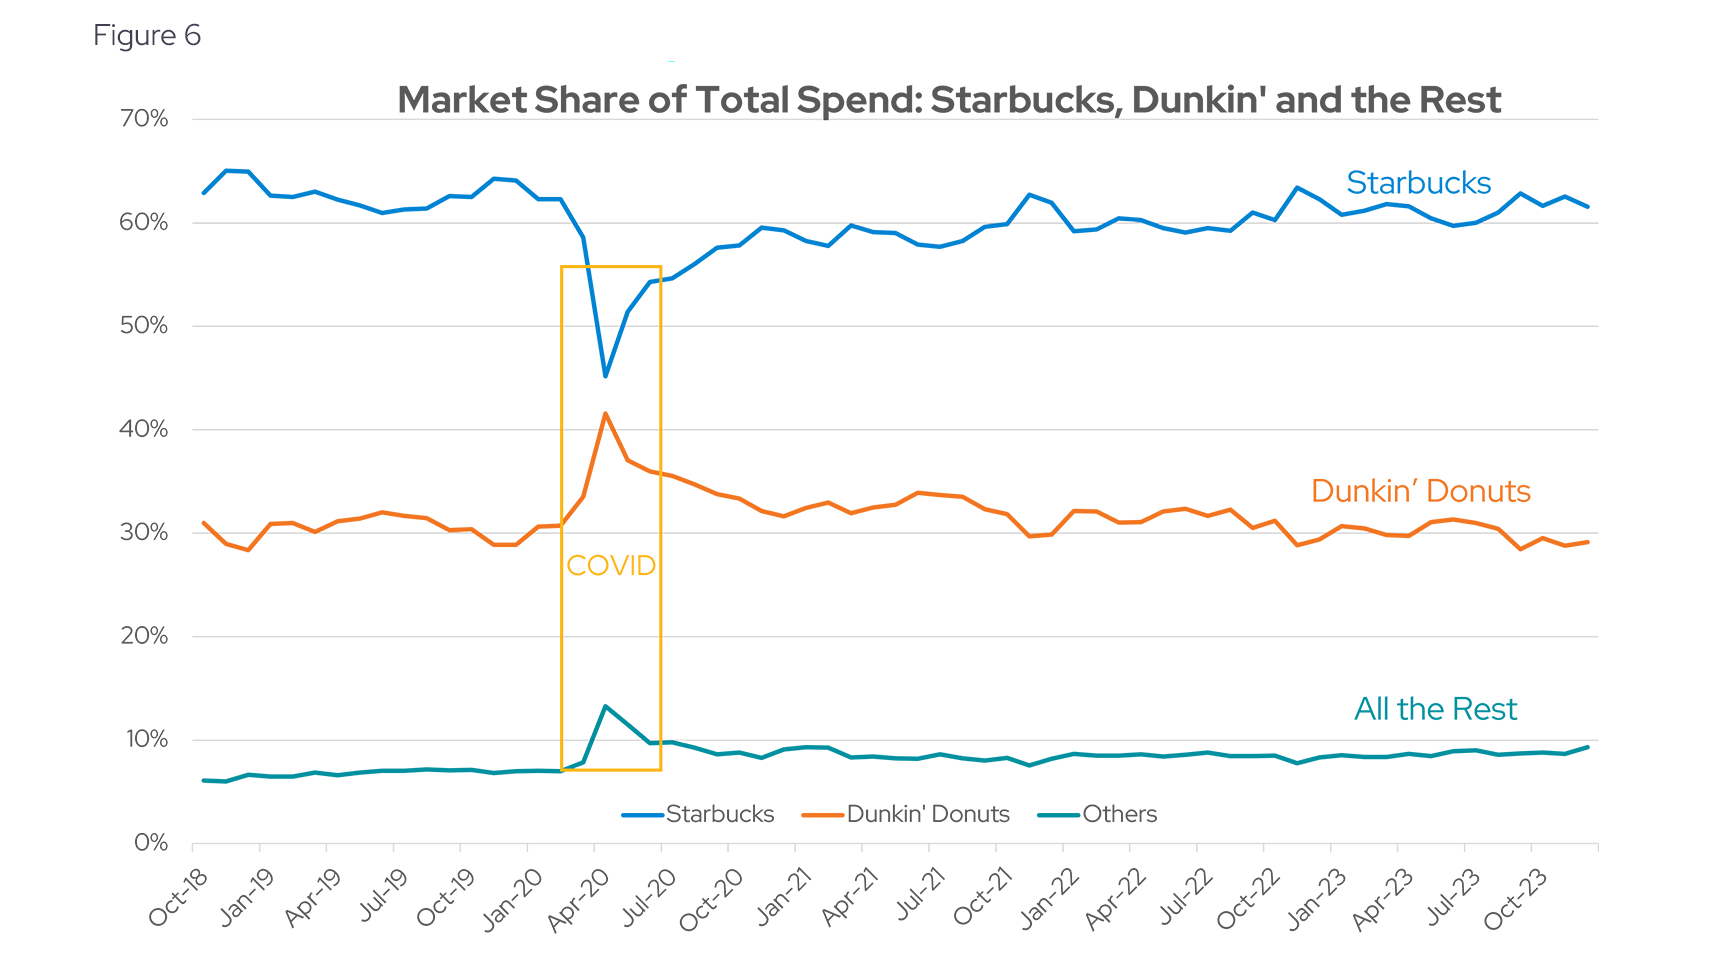
All spending was subdued during the lockdowns but the convergence we see around COVID implies that spending slowed more at Starbucks relative to other coffee chains. This is likely due to one clear advantage Dunkin’ Donuts has over its larger counterpart: they have a lot more drive-through locations than Starbucks. People preferred these locations during the pandemic, but since the recovery, Starbucks has gained ground and has continued to chip away at Dunkin’s market share, solidifying its substantial lead. The rest of the coffee chains we analyzed made up just under 10% of the spending share and have remained stable (according to Figure 6)
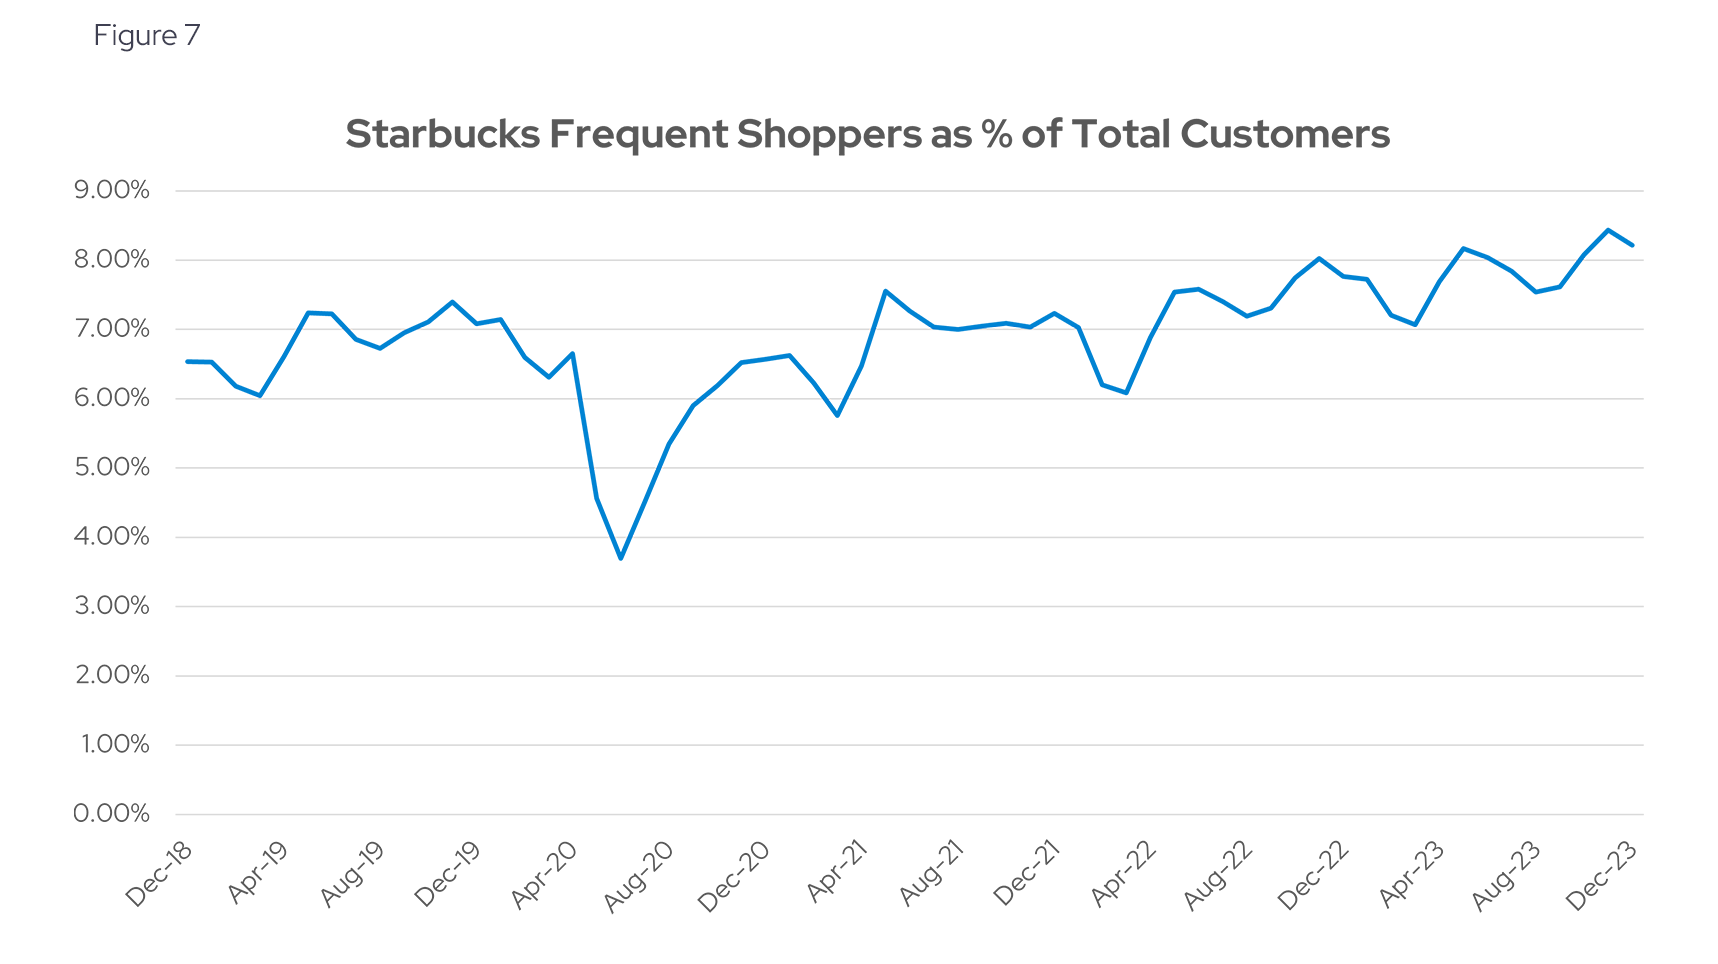
This dominance was seemingly not enough to meet market expectations of Starbucks leading to some disappointing performance this year. Data points to Starbuck’s slowing YoY growth of total spending and slow growth of frequent shoppers.
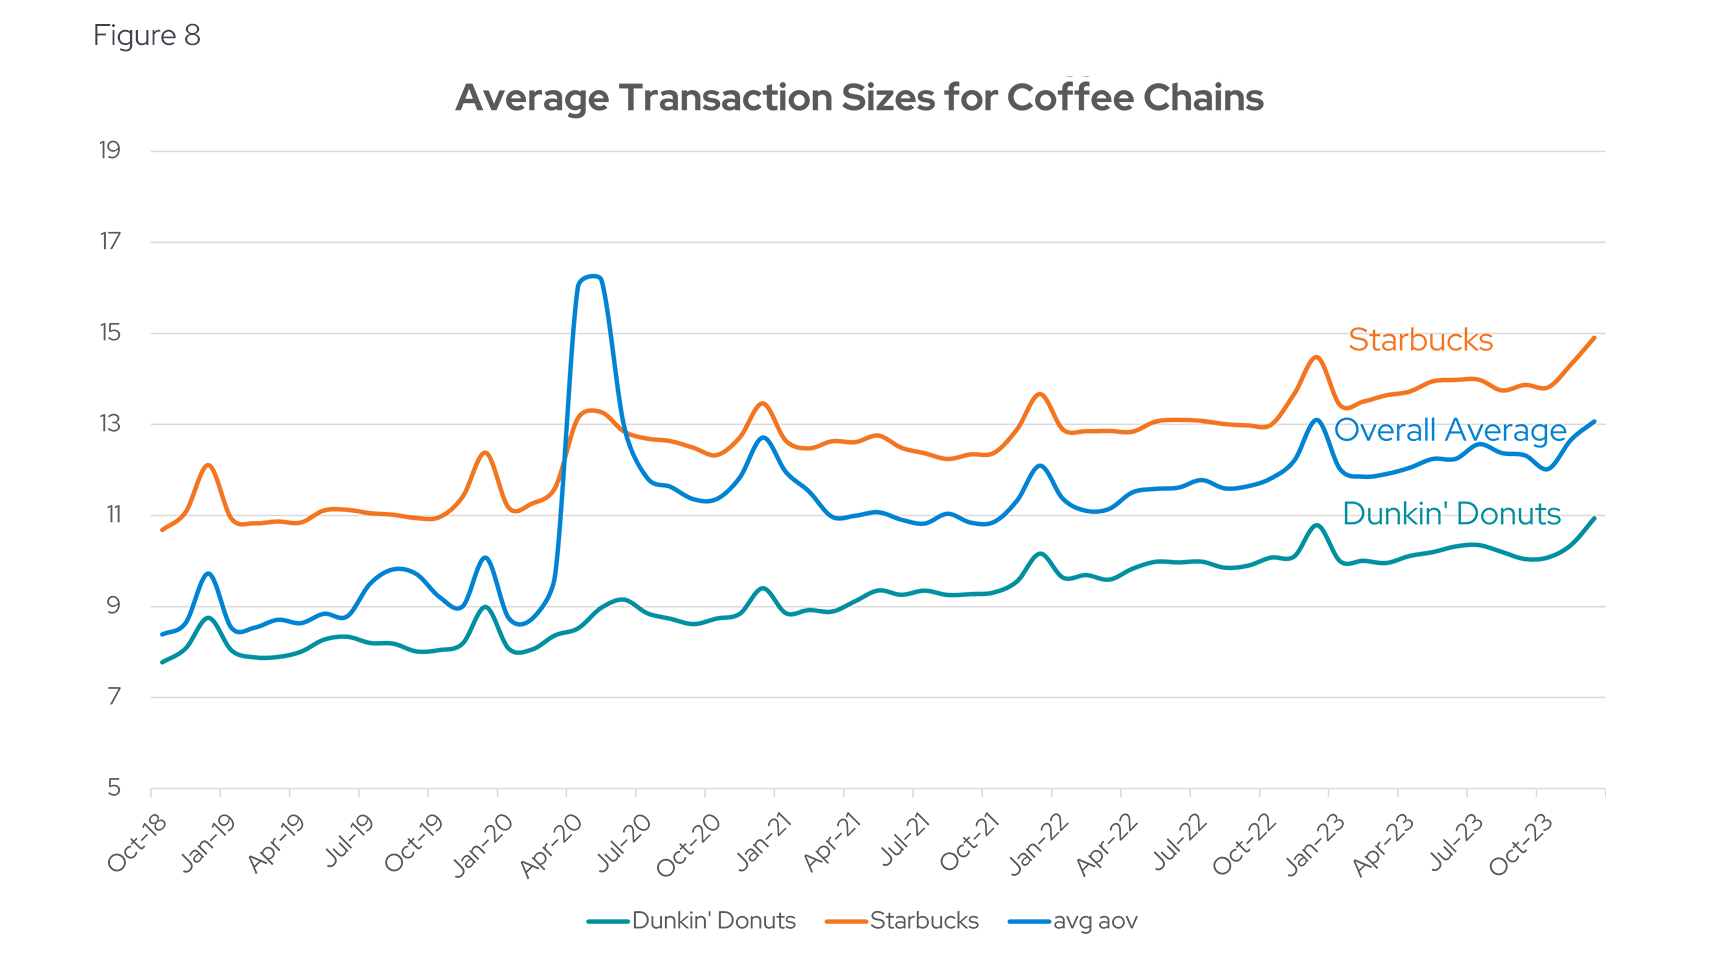
In addition, Starbucks’ product is relatively pricey compared to the others and Dunkin’ is cheaper than average, though all chains have steadily increased their AOVs with time as we can see from Figure 7. There may be limited AOV increases that Starbucks can count on going forward given inflation’s downward trend.
Coffee can be addictive, but how addictive are the coffee chains?
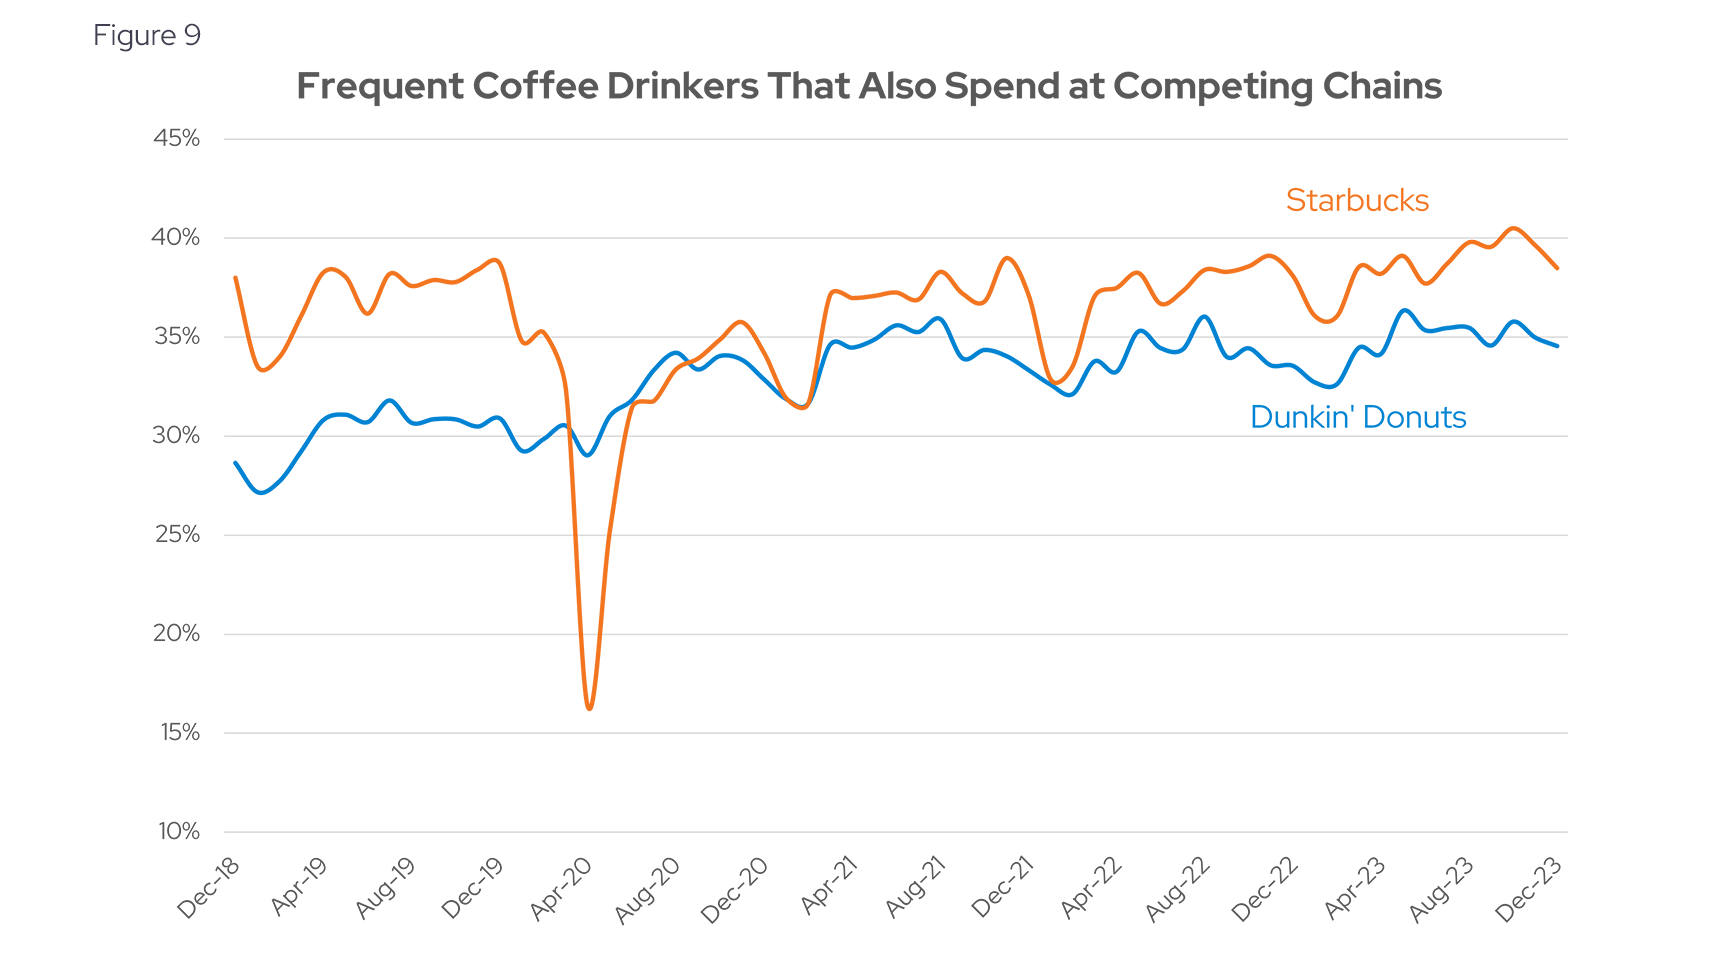
We defined a “frequent coffee drinker” as someone who made a purchase from a specific chain at least five times in the prior three months (or bought a refill card for Starbucks). This cohort of coffee drinkers proved to be small but important for each chain and contributed a significant portion of the chain’s total spending. Starbucks frequent coffee drinkers were 8.3% of total customers (on December 2023) but made up an average of 31% of total spending for the chain. Dunkin’ Donuts frequent coffee drinkers are also 8.3% of all customers yet contributed 38% of total spending.
The loyalty of these coffee drinkers can be gauged by how many of them also spent at other chains. Here, Starbucks frequent coffee drinkers were among the most loyal with only 35% of them spending at other chains, compared to 38% for Dunkin’ Donuts (see Figure 8)
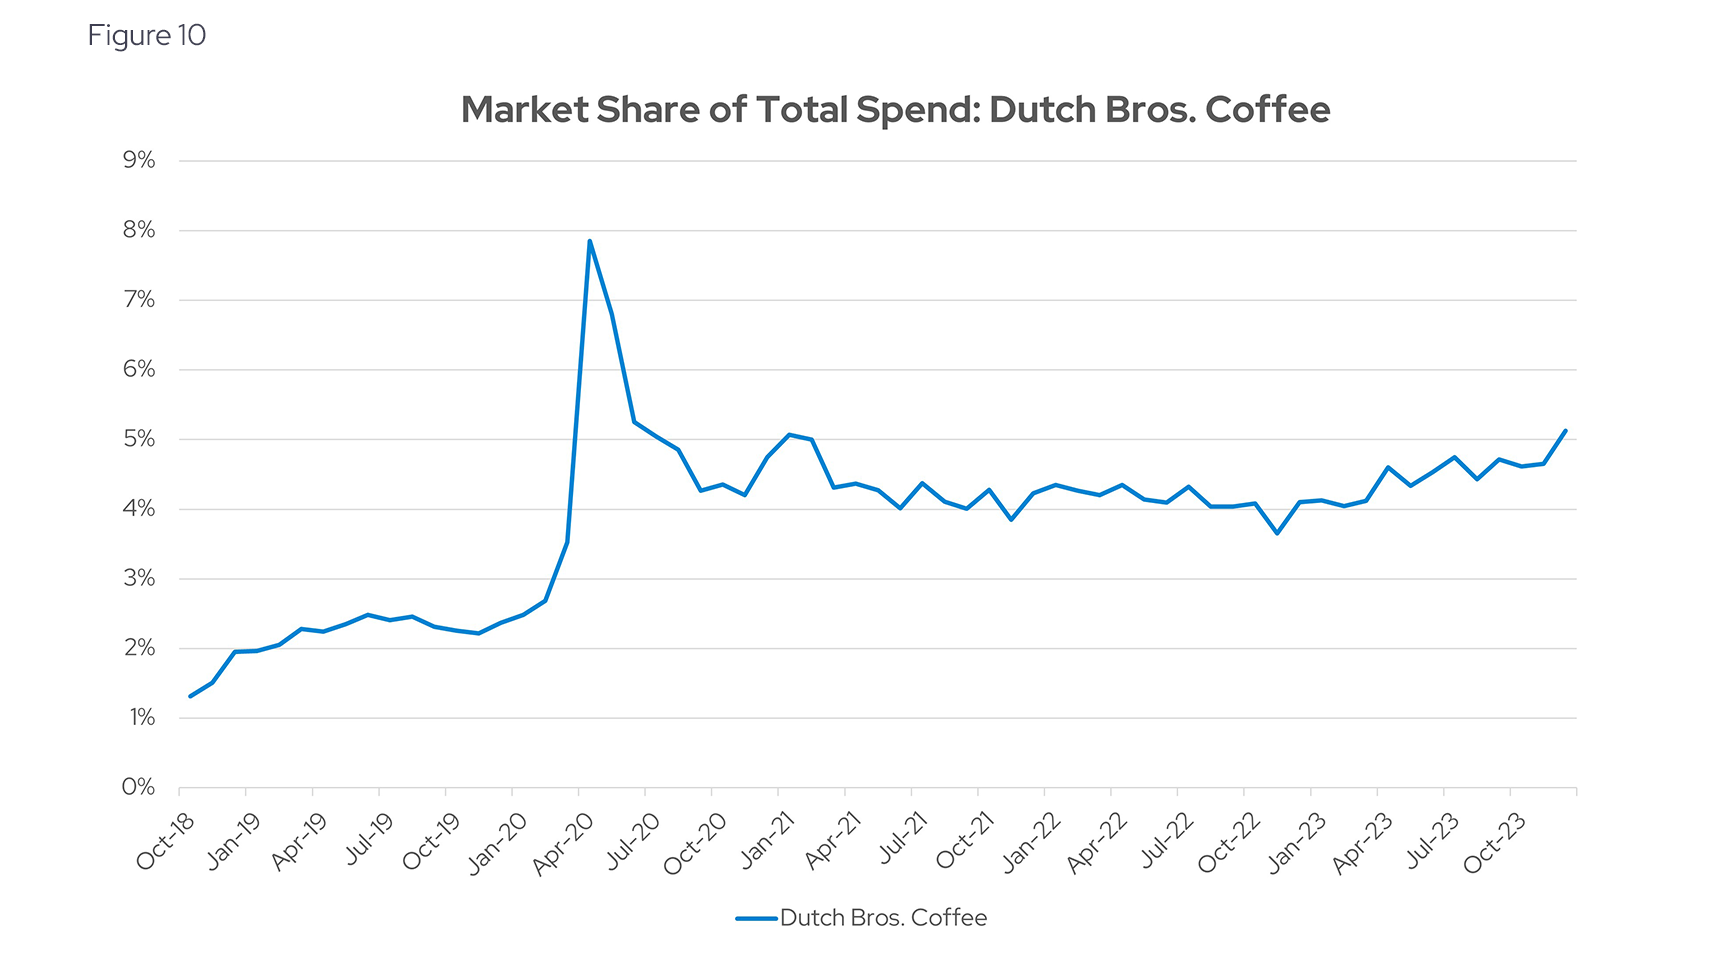
Not all coffee chains are struggling to keep market share. Dutch Bros. Coffee, in particular has seen recent growth, adding a percentage point since January of this year, according to Figure 10 which tracks the chain’s market share of total spending.
A few parting sips
Our deep dive into the transaction data of popular coffee chains paints a nuanced picture of the coffee industry's spending dynamics. Despite coffee's unwavering presence in American culture, the trends we've observed point to shifts in spending patterns and interesting seasonality: the surprising winter dip in sales, the slowing growth in total spending despite a rising number of coffee drinkers, and the dominance of Starbucks a sector that is both robust and competitive.
Going forward, granular spending data will help investors stay ahead of developing trends and help assess the staying power of Starbuck’s dominance in the space.
Envestnet | Yodlee: Data + Intelligence
The analysis in this article is based on an Envestnet | Yodlee dataset comprised of de-identified US credit and debit card transactions. Yodlee Merchant, Retail, Shopper, and Spend Insights utilize de-identified transaction data from a diverse and dynamic set of millions of accounts to identify patterns and context to inform spending and income trends. The trends reflect analysis and insights from the Envestnet | Yodlee data analysis team. By combining data with intelligence – connecting vast amounts of actual de-identified shopping data with state-of-the-art analytics and machine learning – Envestnet | Yodlee provides visibility into daily purchase behavior including transactions, customer lifetime values, and merchant/retailer shares.
Want to see how transaction data can inform your investment process?
Learn more about Envestnet | Yodlee Merchant and Retail Insights and get a free demo from a sales representative.