Admit it: Every January, you resolve to take better care of yourself. And maybe you stick with it for a short while, then lose your resolve, then fall back into old habits. And next January, you try again.
Extrapolate that experience across the American consumer base, and you’d expect to see a cyclical trend in first-quarter spending in self-improvement sectors, with a burst of spending activity in January followed by a steep cooldown in February and March.
You might also expect to find that COVID disrupted this trend, with remote work and social distancing leading many consumers to opt for at-home self-improvement services over those that require consumers to step out. And you might expect these spending trends to revert to pre-pandemic norms with mass vaccinations and the easing of COVID restrictions.
To gauge these hypotheses, Envestnet® | Yodlee®’s research team crunched the numbers, analyzing performance among retailers who focus on healthy eating, exercise, and sporting gear and apparel. Using our vast array of consumer spending and transaction data, Envestnet | Yodlee tracked year-over-year changes in Q1 spending, as well as year-to-date spending trends in 2022. The study seems to confirm the expected trends, and it may offer retailers and consumers alike a hint as to how these trends may play out in the self-improvement sector as Americans resolve (again) to become more fit in early 2023.
Healthy Eating
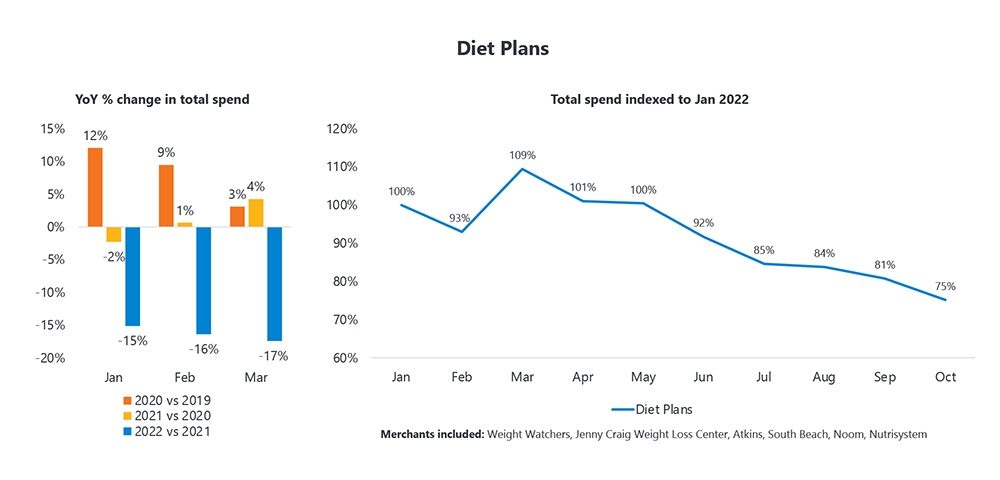
Even though membership diet plans like Weight Watchers went into 2020 earning as much from digital subscriptions as from members who gathered in person, the diet plan sector did see spending drop during the onset of social distancing. In the first quarter of 2020, before COVID shutdowns began, spending was high in January and dropped in February and March. A year later, spending was much weaker in January 2021 but picked up as vaccinations began and people started getting out more. In 2022, diet spending was much softer than before the pandemic, though it was strongest in the first few months of the year.
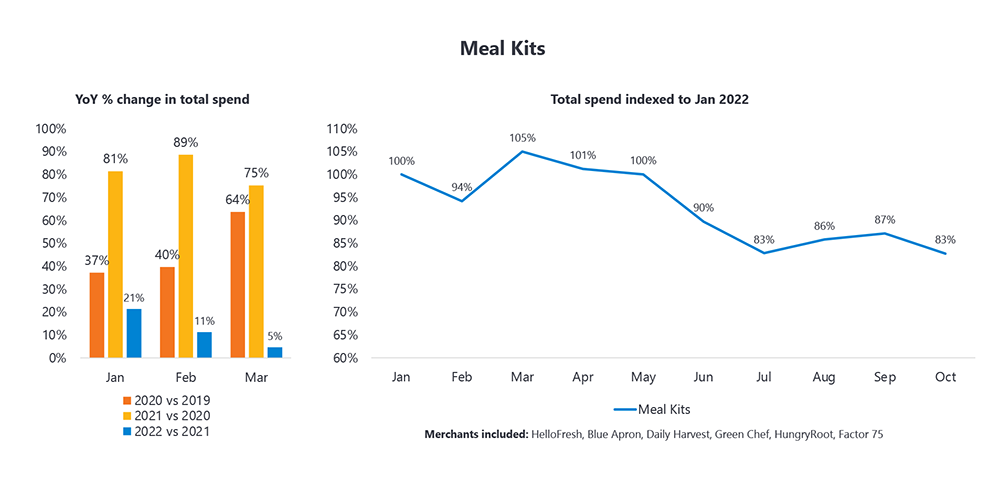
By contrast, meal kit subscription services, which allow consumers to enjoy ostensibly nutritious meals without leaving home, saw robust spending growth in Q1 2020 and nearly doubled in Q1 2021. By 2022, with stay-at-home restrictions lifted, the market appeared to have peaked, though first quarter spending was still stronger than the rest of the year.
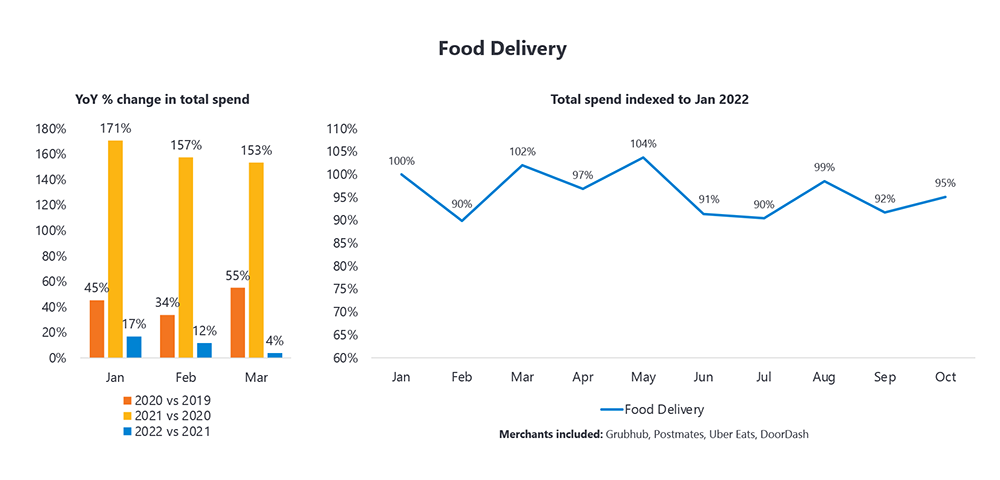
For the sake of comparison, the home food delivery sector – that is, general restaurant and grocery couriers such as Grubhub and DoorDash — performed much the same way that specialty meal kit subscriptions did in recent first quarters. Indeed, spending nearly tripled in early 2021. But spending throughout 2022 has remained much more consistent. And that’s despite dramatic inflation throughout 2022 that saw at-home food prices rise by as much as 12%. The discipline to keep having low-carb, low-fat meals delivered may have flagged after Q1, but the demand for fatty, carb-laden restaurant delivery orders seems pretty stable.
Exercise
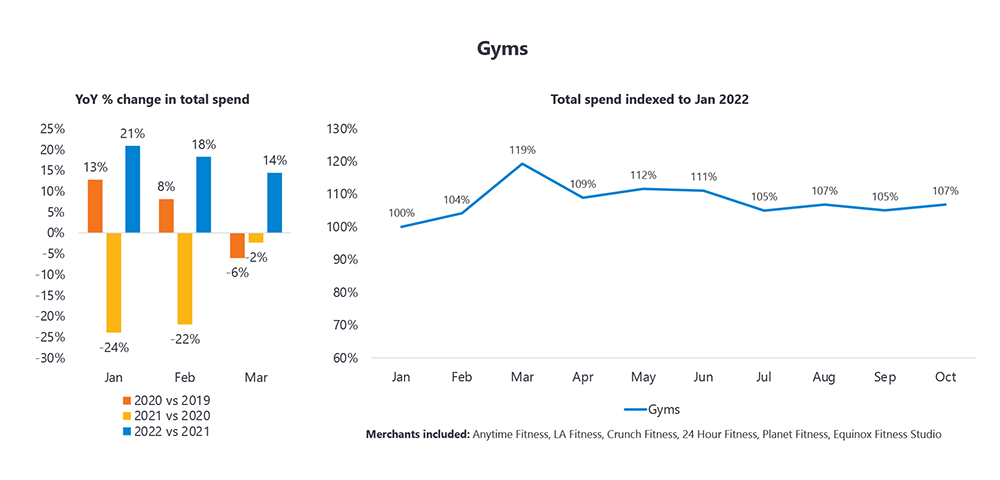
In early 2020, spending on gym memberships saw the cyclical declines you would expect after January. In 2021, however, spending was drastically lower, though it began to pick up in March as vaccinations began to allow a return to gyms. A year later, gym spending had come roaring back. Over the course of 2022, gym spending surprisingly peaked in March, and while it slid a little bit in recent quarters, it has still stayed above January levels. It could be that going to the gym more often is one resolution Americans actually kept. Or maybe they just reactivated gym memberships and kept auto-paying without actually going. (You’ve done that, right? We know we have.)
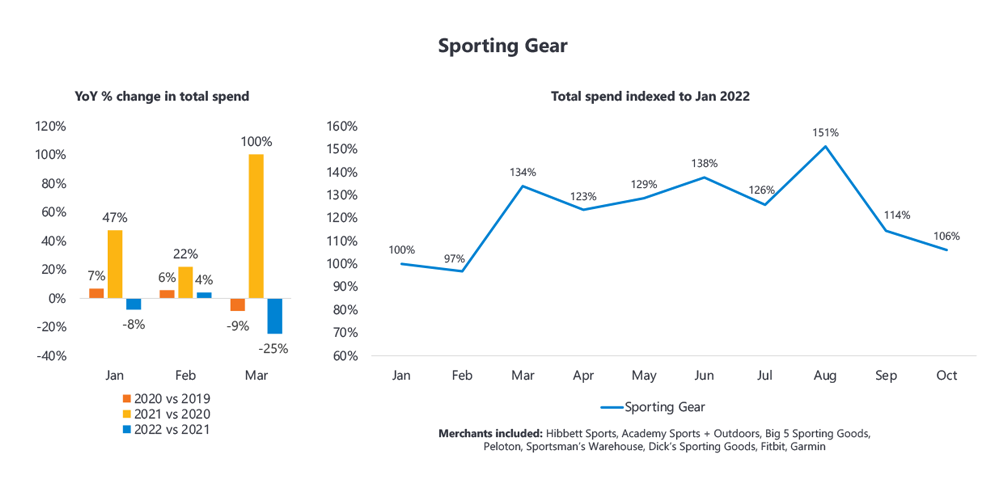
Performance was very different in what we are calling the sporting gear sector, which includes home workout gear like Peloton, wearable health trackers like Fitbit, and other athletic and camping equipment. Sporting gear spending began to fall in early 2020 but shot up dramatically in Q1 2021. By Q1 2022, spending began to return toward pre-lockdown levels. Year-to-date, however, spending hit an early peak in March and then rose even more during the summer, before slipping back to Q1 levels during the fall. That summer high could have been due to spikes in inflation, exacerbated by lingering supply chain issues. Or it could just have been the warm weather, encouraging long shut-in consumers to explore outdoor fitness activities again.
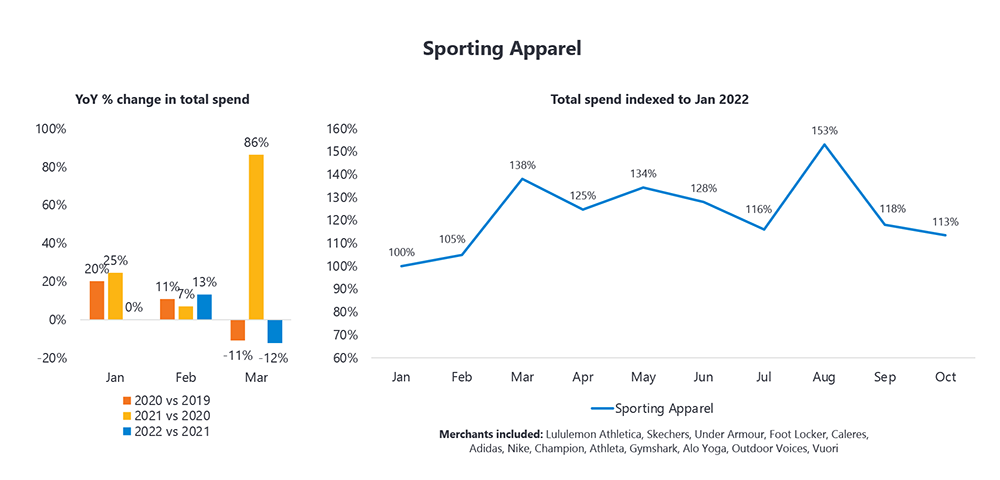
For comparison’s sake, the sportswear sector, including athletic shoe manufacturers and athletic wear clothing lines, performed very much as sporting gear did. It’s worth noting that, in both spaces, e-commerce sales picked up during the pandemic but continued to make up a significant share of sales even after customers returned to brick-and-mortar retailers. It’s also worth noting that some sportswear brands, notably Nike, are often bypassing third-party retailers and selling directly to consumers through their own stores and websites. (For more on how Envestnet | Yodlee can help provide shopping trend data and analytics for a retailer’s on-site and online sales, click here.)
Resolved
Self-improvement spending may remain cyclical. If the dieting and meal kit sectors are any indication, the disruptions of COVID haven’t changed Americans’ habits of exercising some self-discipline at the beginning of the year and less as the year winds down. But after two years of isolating at home, consumers have shown themselves ready to get back out into the world to get fit, either at the gym or in the great outdoors. Inflation, supply-chain snags, and the lingering preference for remote work don’t seem to be slowing down consumer spending for out-of-home self-improvement goods and services. All that’s slowing us down is the occasional delivery order of loaded nachos.
For more insights into consumer spending and transaction trends, visit our Resources page.
About Envestnet | Yodlee Merchant, Retail, Shopper, and Spend Insights
Envestnet® | Yodlee® Merchant, Retail, Shopper and Spend Insights utilize de-identified transaction data from a diverse and dynamic set of data from millions of accounts to identify patterns and context to inform spending and income trends. The trends reflect analysis and insights from the Envestnet | Yodlee data analysis team. By combining data with intelligence – connecting vast amounts of actual de-identified shopping data with state-of-the-art analytics and machine learning – Envestnet | Yodlee provides visibility into an entire set of shopping daily purchase behavior including, but not limited to, transactions, customer lifetime values, and merchant/retailer shares.
To learn more about Envestnet® | Yodlee® Merchant and Retail Insights and get a free demo, please contact an Envestnet® | Yodlee® sales representative or visit https://www.yodlee.com/data-analytics/corporate-data.