Envestnet® | Yodlee® data analytics offers investors insights into recent supermarket sector spending trends
Any food shopper who’s been monitoring his or her supermarket receipts in recent months knows that inflation has been a persistent factor in grocery customer behavior. Similarly, smart investors have noted that inflation-driven shopping behavior has been key to understanding performance of companies in the grocery sector.
Envestnet® | Yodlee® researchers have used our data analytics to track the performance of well-known grocery chains in order to spot consumer spending trends that may yield alpha-generating signals for investors. In particular, our team noticed the role of inflation, especially as it spiked during the past year, has influenced consumer spending behavioral trends throughout the grocery sector. One impact has been a shift in market share away from higher-end grocers toward more modestly priced chains.
Using our proprietary consumer spending and transaction data and the visualization tools offered via our channel partner Maiden Century’s IDEA platform1, our team was able to observe and chart food shopping trends for the grocery sector at large and for individual supermarket chains. Read on to learn what we found, and how investors using these tools might have leveraged such data and visualizations to make informed investment decisions.
Inflationary Pressures
While 2022 saw inflation rise to levels unseen in 40 years, prices have begun to ease for many consumer goods in recent months. Still, food prices have remained consistently high, while energy and transportation costs, which in turn affect food prices, have also sustained higher rates. According to the federal government’s Consumer Price Index (CPI) reporting, food-at-home prices in February 2023 were still up 10.2% year over year. But most of that price spike occurred over the summer; recent months have seen grocery inflation slow to a trickle, with food prices rising just half a percent or less each month since December.
That’s good news for lower cost grocers, but for the higher-end chains, the damage may already have been done.
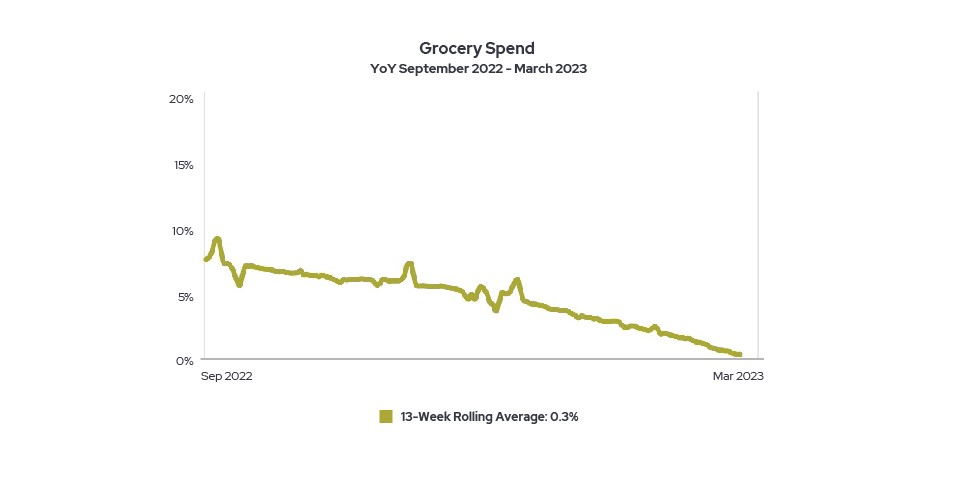
A macro look at the sector2 over the past three years, looking at total grocery consumer spend calculated year-over-year, shows a peak near the beginning of the pandemic in 2020, as shoppers stocked up on staples that were in short supply. Spending dipped throughout 2020 and 2021 but climbed again in 2022 as pandemic restrictions eased, demand surged, and inflation soared. Since August, however, overall grocery spend has declined year-over-year.
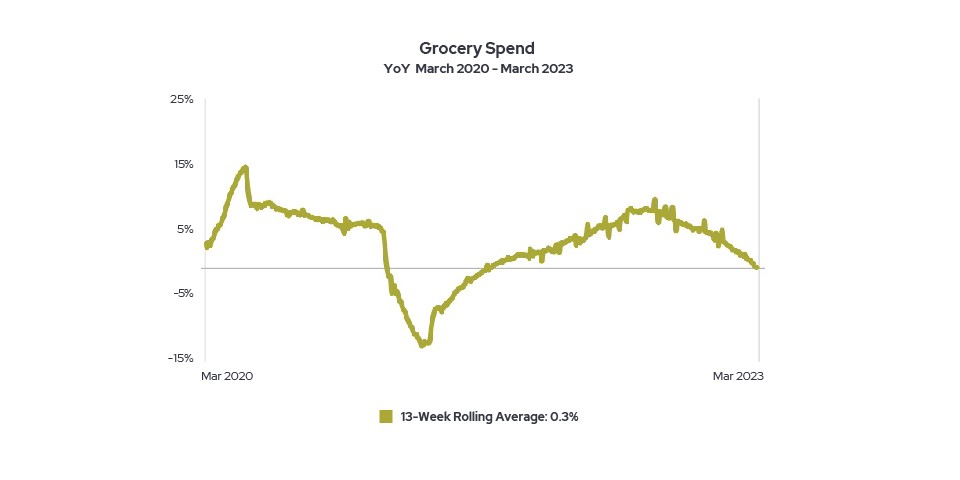
Indeed, the decline has been largely steady and consistent over the last six months.
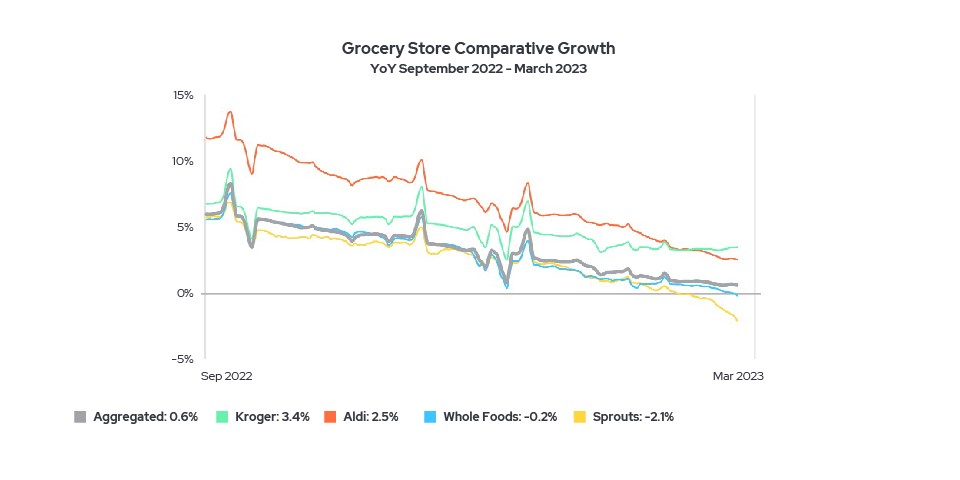
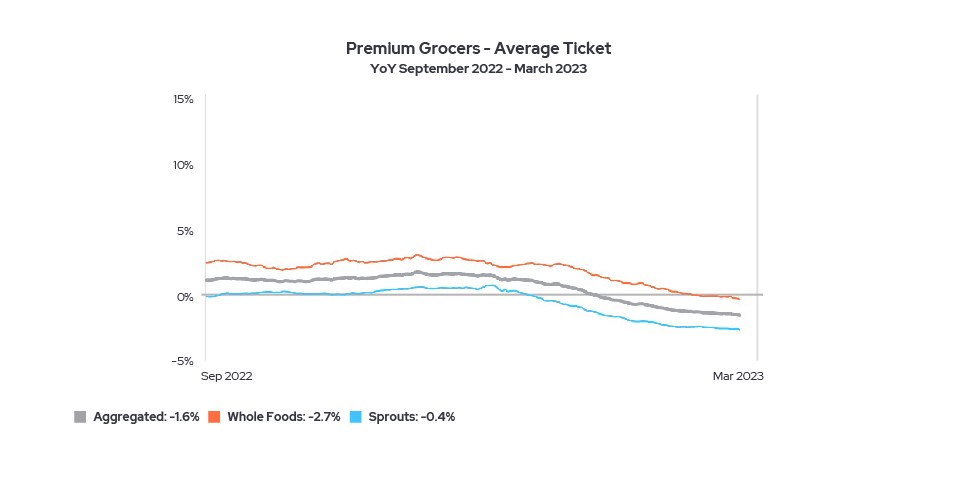
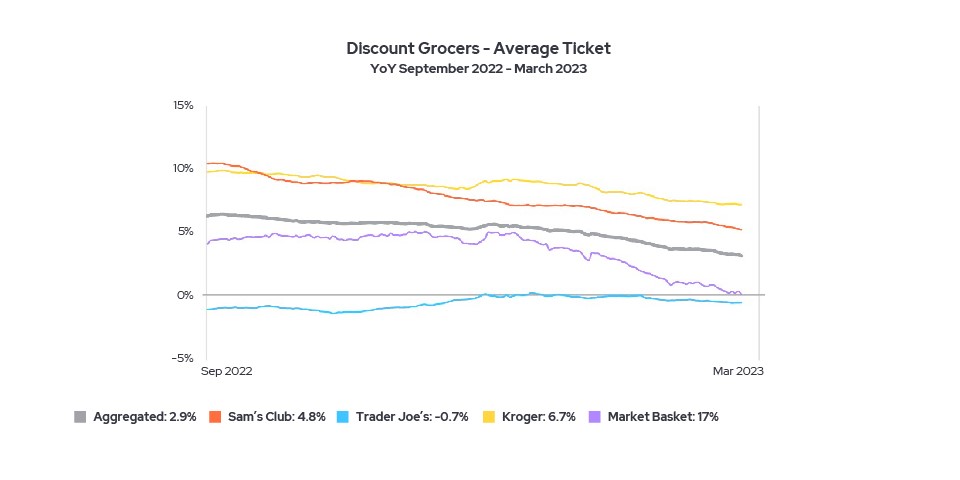
But not all grocery chains have experienced the decline in the same way. Drilling down to merchant performance, the pattern diverges, with higher-end chains like Sprouts and Whole Foods experiencing negative growth year-over-year, while the standard chains like Aldi’s and Kroger still trend positive overall. The pattern of reversals, as seen in the charts below, is especially dramatic for the higher-end grocers tracked over the past three years and even over just the last six months.
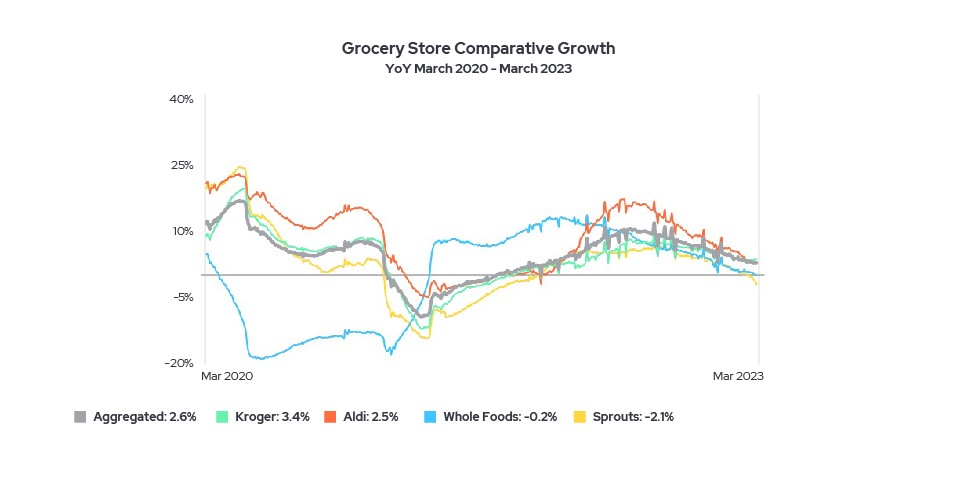
The divergence becomes even clearer when comparing the average ticket size at each grocer. By early March 2023, the average spend per visit at the costlier stores was down 1.5% year over year.
But for the lower cost supermarkets, that figure was up an average of 3.1%. Among the more modestly-priced chains Envestnet | Yodlee tracked – among them, Market Basket, Kroger, and Sam’s Club – only Trader Joe’s (which arguably borders on the high end) saw average ticket size decline overall, down 0.6%.
(To learn more about how Envestnet | Yodlee spending data can help investment researchers, asset managers, and investor relations officers gain actionable insights and find alpha-generating signals, download our one-page product data sheet.)
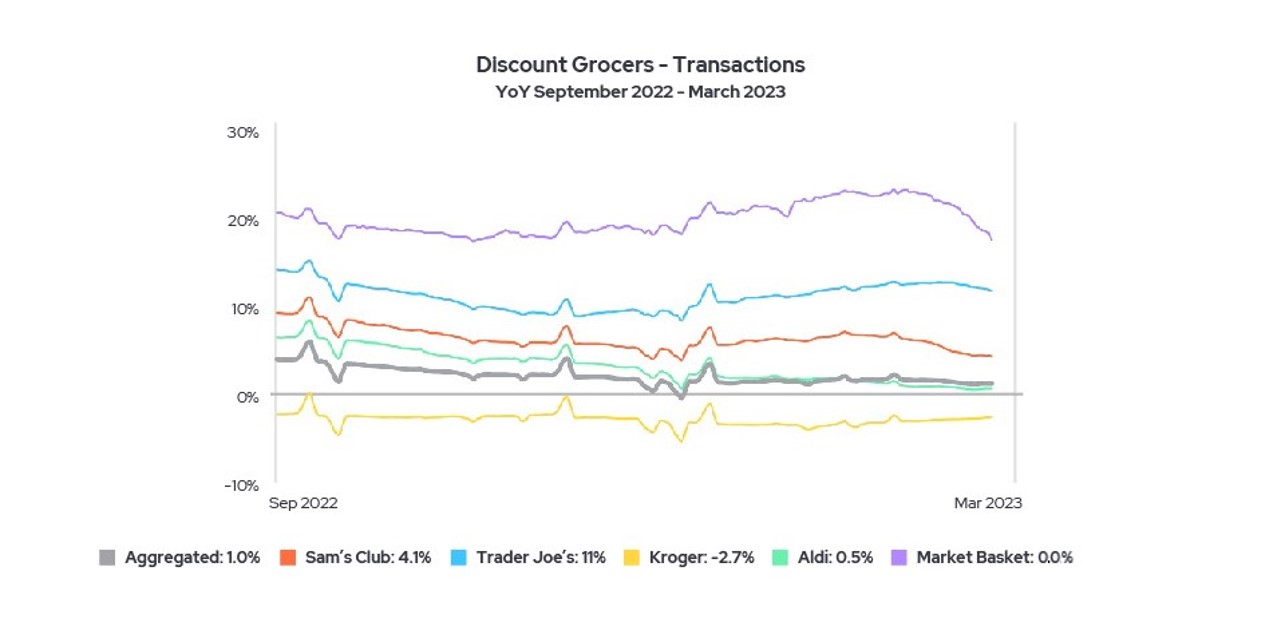
Counting the average number of transactions per grocery chain, there’s a mild rebound (up 0.8%) over the last six months for the less expensive stores, with only Kroger seeing fewer transactions year-over-year.
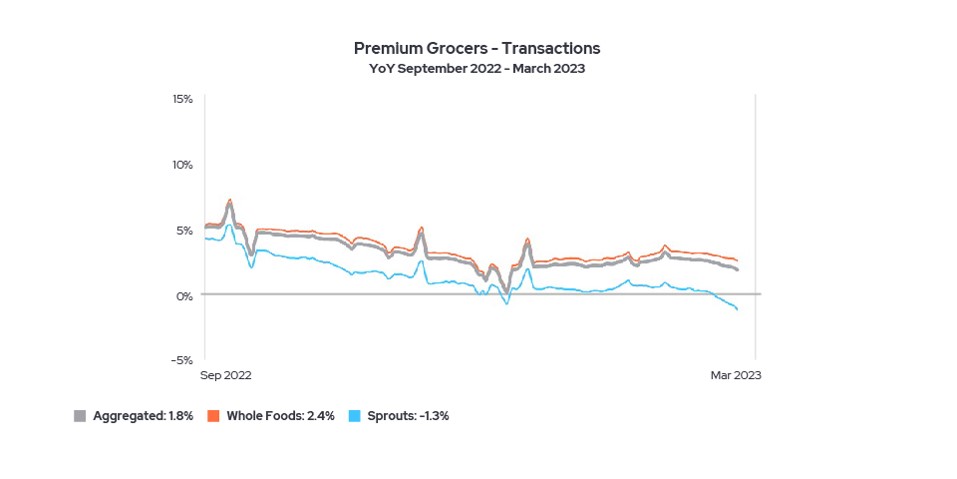
In contrast with most of these stores, Whole Foods and Sprouts have struggled to keep clients coming back at the rates they did the previous year.
Industry analysts have said they believe that shoppers’ appetite for premium groceries – including organic and gourmet items – hasn’t diminished. But Envestnet | Yodlee data suggests that consumers have been unwilling lately to buy them at the higher-priced stores. Rather, as analysts have suggested, they’re buying the lower-end grocers’ own less expensive gourmet-label and organic products. That would help explain why, according to Envestnet | Yodlee data, they’re spending less at the higher price point stores and visiting less often, with the standard grocers benefiting from increased market share.
If you’re an investment professional who’s interested in how to leverage our data analytics and Maiden Century’s visualizations to gain daily or historical insights into sector and company performance, we encourage you to attend our product webinar on April 20, 2023. Register here.
About Envestnet | Yodlee Alternative Data Analytics for Investment Decisions
Envestnet | Yodlee shopper spending and payroll Insights utilize de-identified transaction data from a diverse and dynamic set of data from millions of accounts to identify patterns and context to inform spending, revenue, and expense trends. The trends reflect analysis and insights from the Envestnet | Yodlee data analysis team. By combining data with intelligence – connecting vast amounts of actual de-identified data with state-of-the-art analytics and machine learning – Envestnet | Yodlee enables asset, investment, and portfolio managers to improve investment decisions, monitor current investments, help manage risk, and seek out alpha-generating positions.
To learn more about Envestnet | Yodlee Investor Data Analytics and get a free demo, please contact an Envestnet | Yodlee sales representative.
Footnotes:
1“Maiden Century,” “IDEA,” and visualizations created through the IDEA dashboard are registered trademarks of Maiden Century and are used here with permission.
2Grocery chains tracked include standard and discount supermarkets such as Kroger, Grocery Outlet, Market Basket, Aldi, Sam’s Club, and Trader Joe’s, along with high-end stores specializing in organic foods such as Whole Foods and Sprouts Farmers Market.