The last decade has witnessed a radical shift in content consumption, propelled by the streaming revolution. Traditional media entities are working hard to stay competitive with Netflix, who has a multi-year head start delivering streaming content. As John Stewart pointed out, consumers still watch TV and want great content, they just want it delivered on-demand and on the move. This has transformed the media landscape as we know it.
This article dives into the recent trends for streaming services as evidenced by de-identified spending data from Envestnet® | Yodlee®. Looking at transaction data from millions of accounts, we can get a view into trends in spending, income, and how content consumption preferences are evolving. So put your iPhones on silent mode and let’s dive in.
The streaming market is worth watching
The streaming market, with its rising costs and competitive pressures, offers a unique investment landscape. The share of consumer wallets dedicated to streaming has notably increased, with spending on these services more than doubling since 2019 (see Figure 1). This trend reflects a growing consumer inclination toward multiple streaming subscriptions, significantly impacting overall spend.
Key performance indicators include:
- Subscription trends and their sustainability (loyalty in a dynamic market)
- Average spend (consumer willingness to pay a premium)
- Market share (competitive positioning of content)
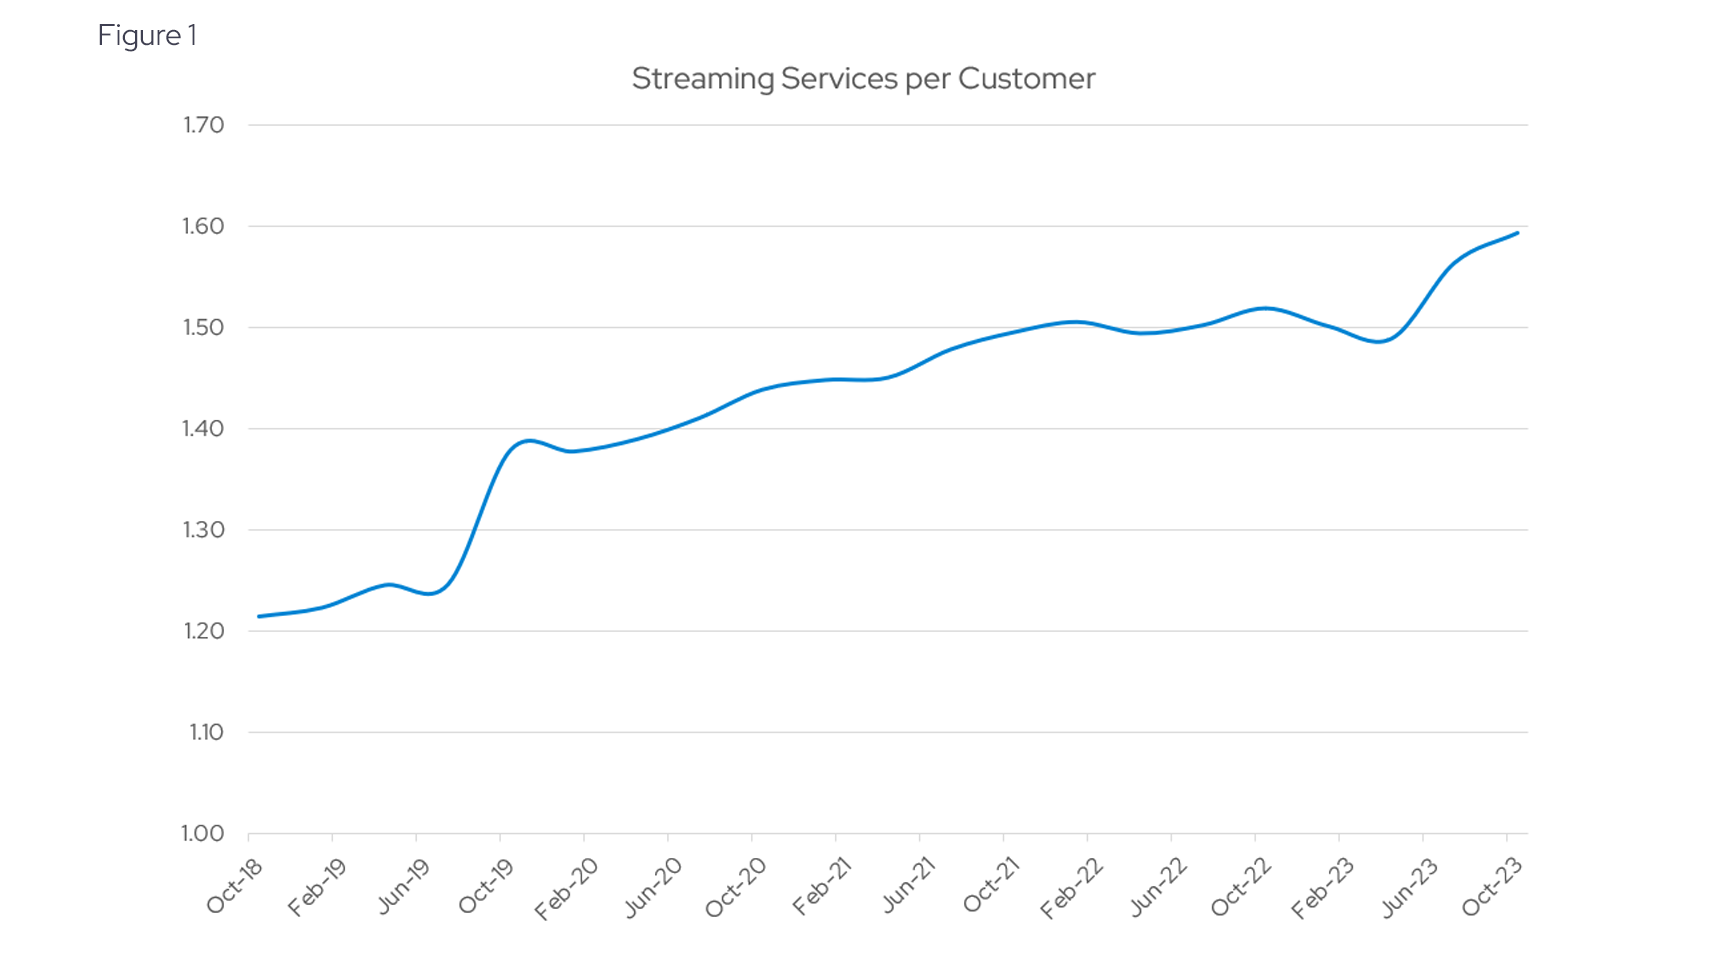
Figure 1 illustrates the average number of streaming service subscriptions identified in consumer transactions. Based on our experience, this figure likely underrepresents the true total, especially considering bundled services like those offered by Disney Plus, Hulu, and ESPN. Nonetheless, the data reveals a significant trend: over the last five years, there has been a consistent increase in consumers opting for multiple subscriptions, leading to a higher overall spending on streaming services.
Streaming’s rising share of consumer wallets
Overall, spend on streaming has increased 25% in the past two years, and more than doubled since 2019, easily outpacing inflation and the general increase in total spend. It’s not just inflation driving the increase in spending, though there is some of that in the data as well. Another factor is that people seem to be getting accustomed to paying for more than one streaming subscription service.
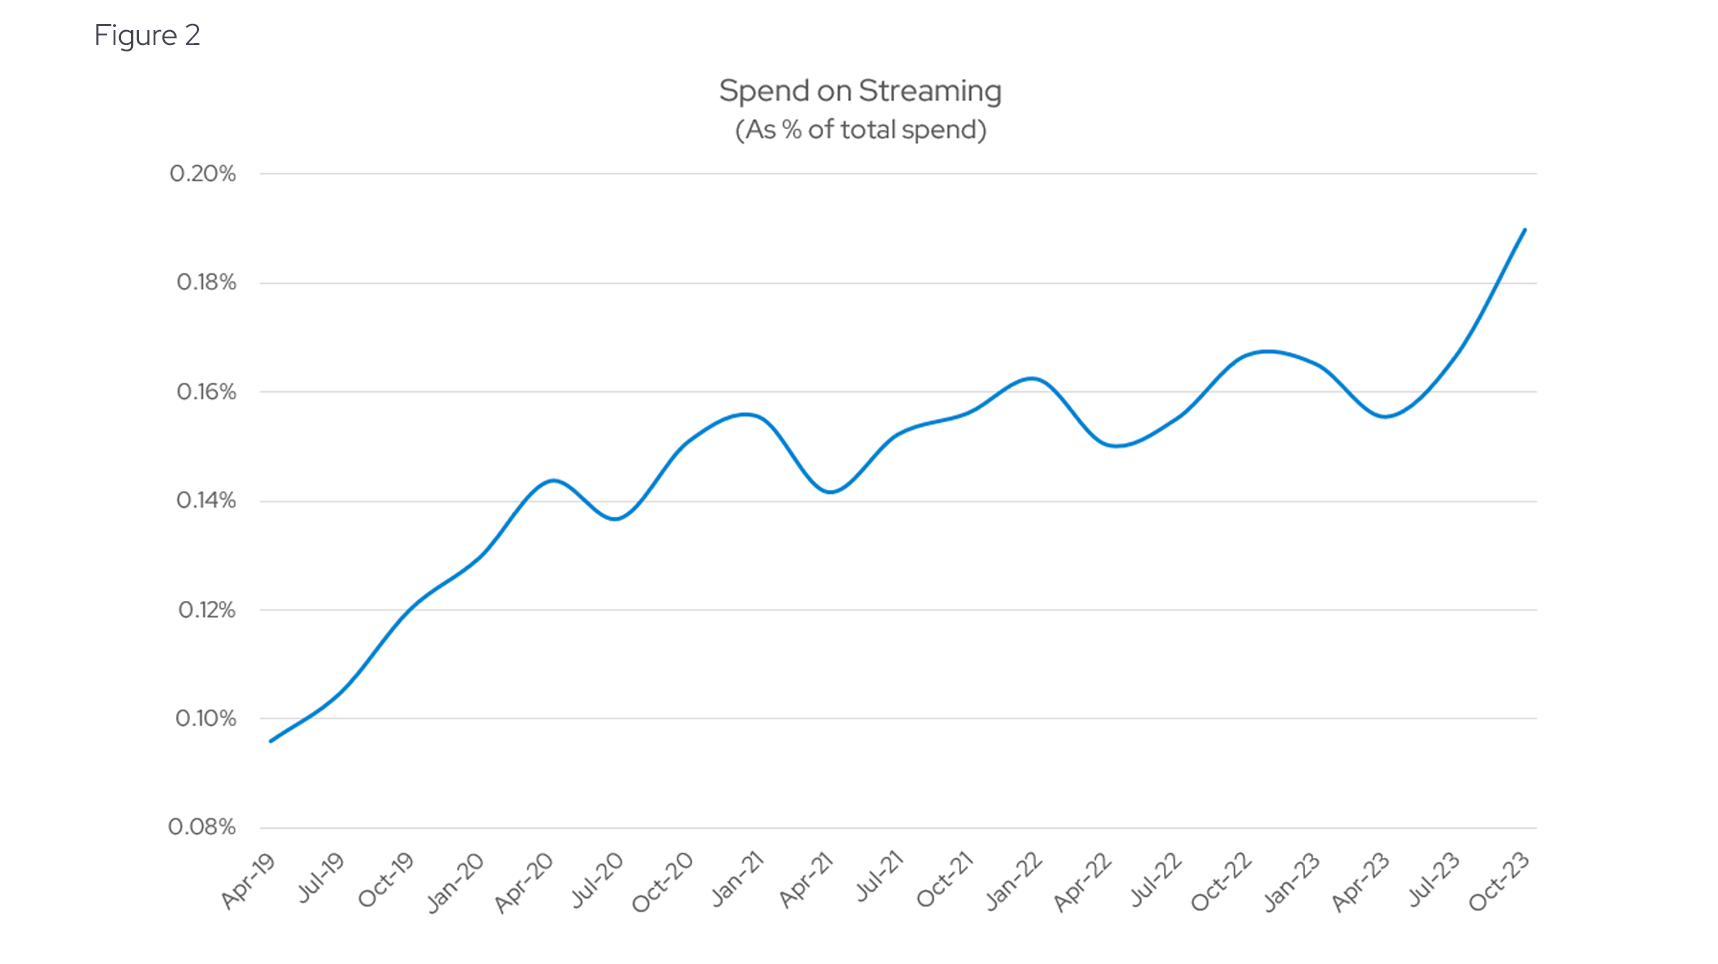
The seasonal variations highlighted in Figure 2 are predominantly influenced by fluctuations in total consumer spending, rather than changes in streaming service expenditures, which have shown a steady upward trajectory. We expect this trend to persist, fueled by the evolving dynamics of content consumption. The question then arises: which companies stand to gain the most from these trends, and how is the competitive landscape shifting in response?
The battle for market share: The leader versus the upstarts
Dethroning an incumbent is a formidable challenge, and Netflix's reign in the streaming domain exemplifies this.
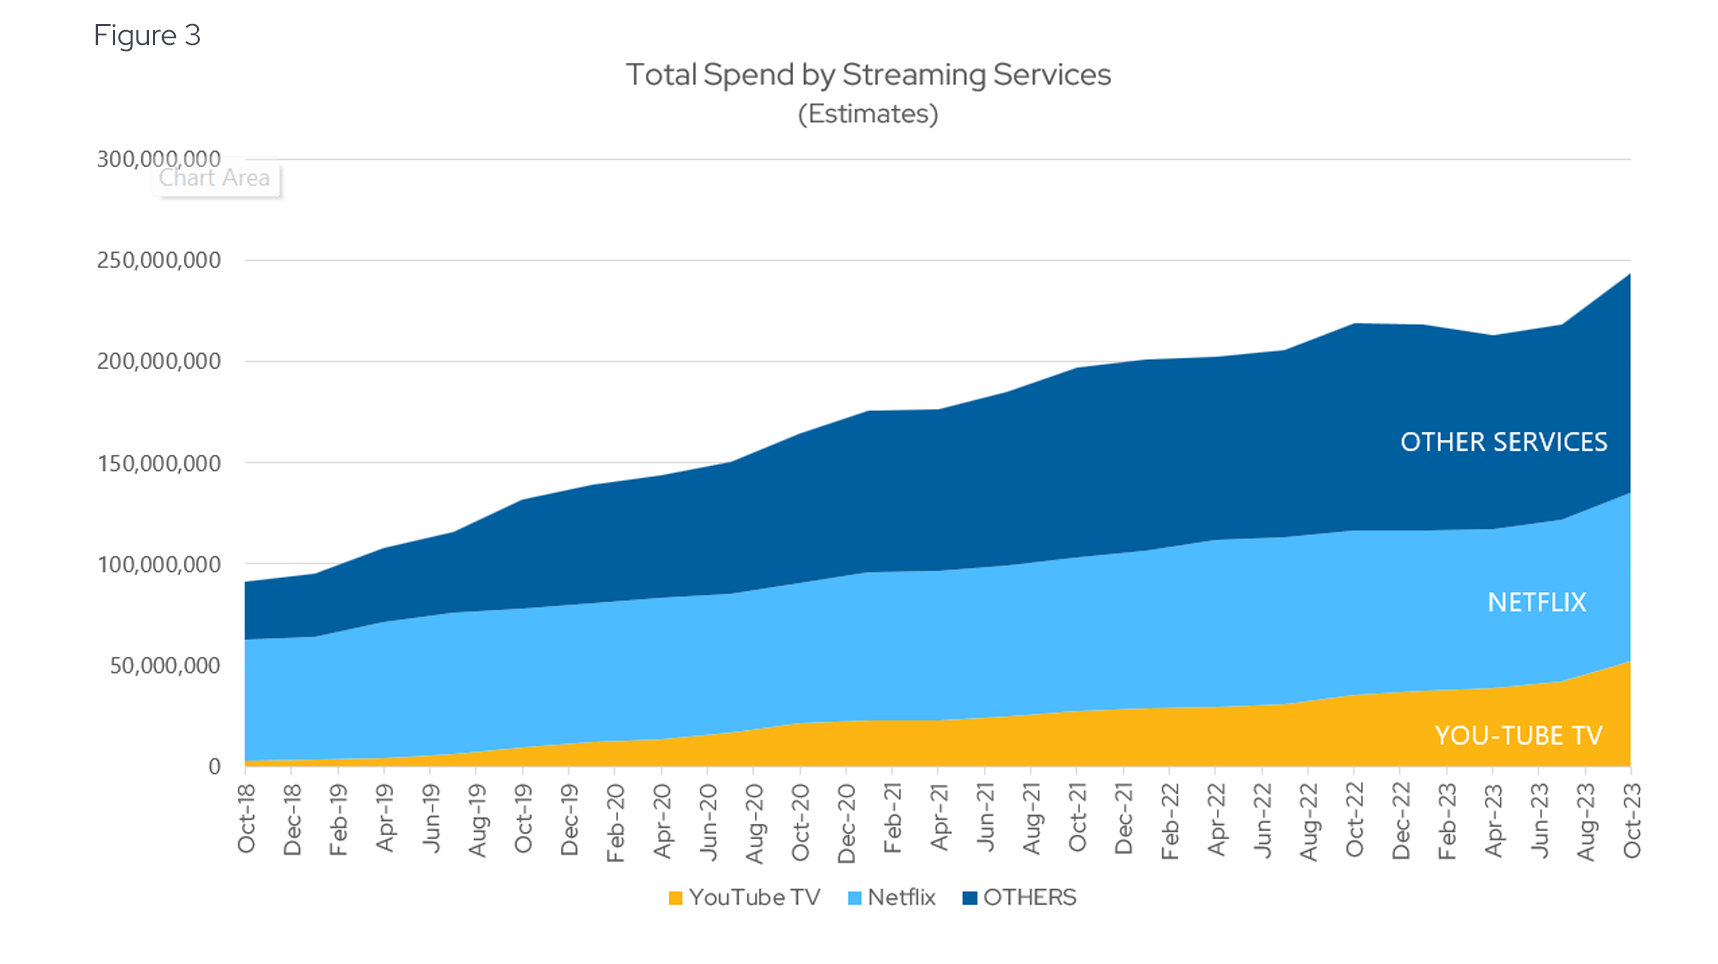
Figure 3 illustrates that spending on Netflix remains robust, showing a significant 40% increase since 2018 despite rising competitive pressures. Yodlee data shows Netflix constitutes approximately one-third of all streaming expenditures (see Figure 4). Despite these limitations, Netflix undeniably continues to be the dominant force in the streaming landscape.
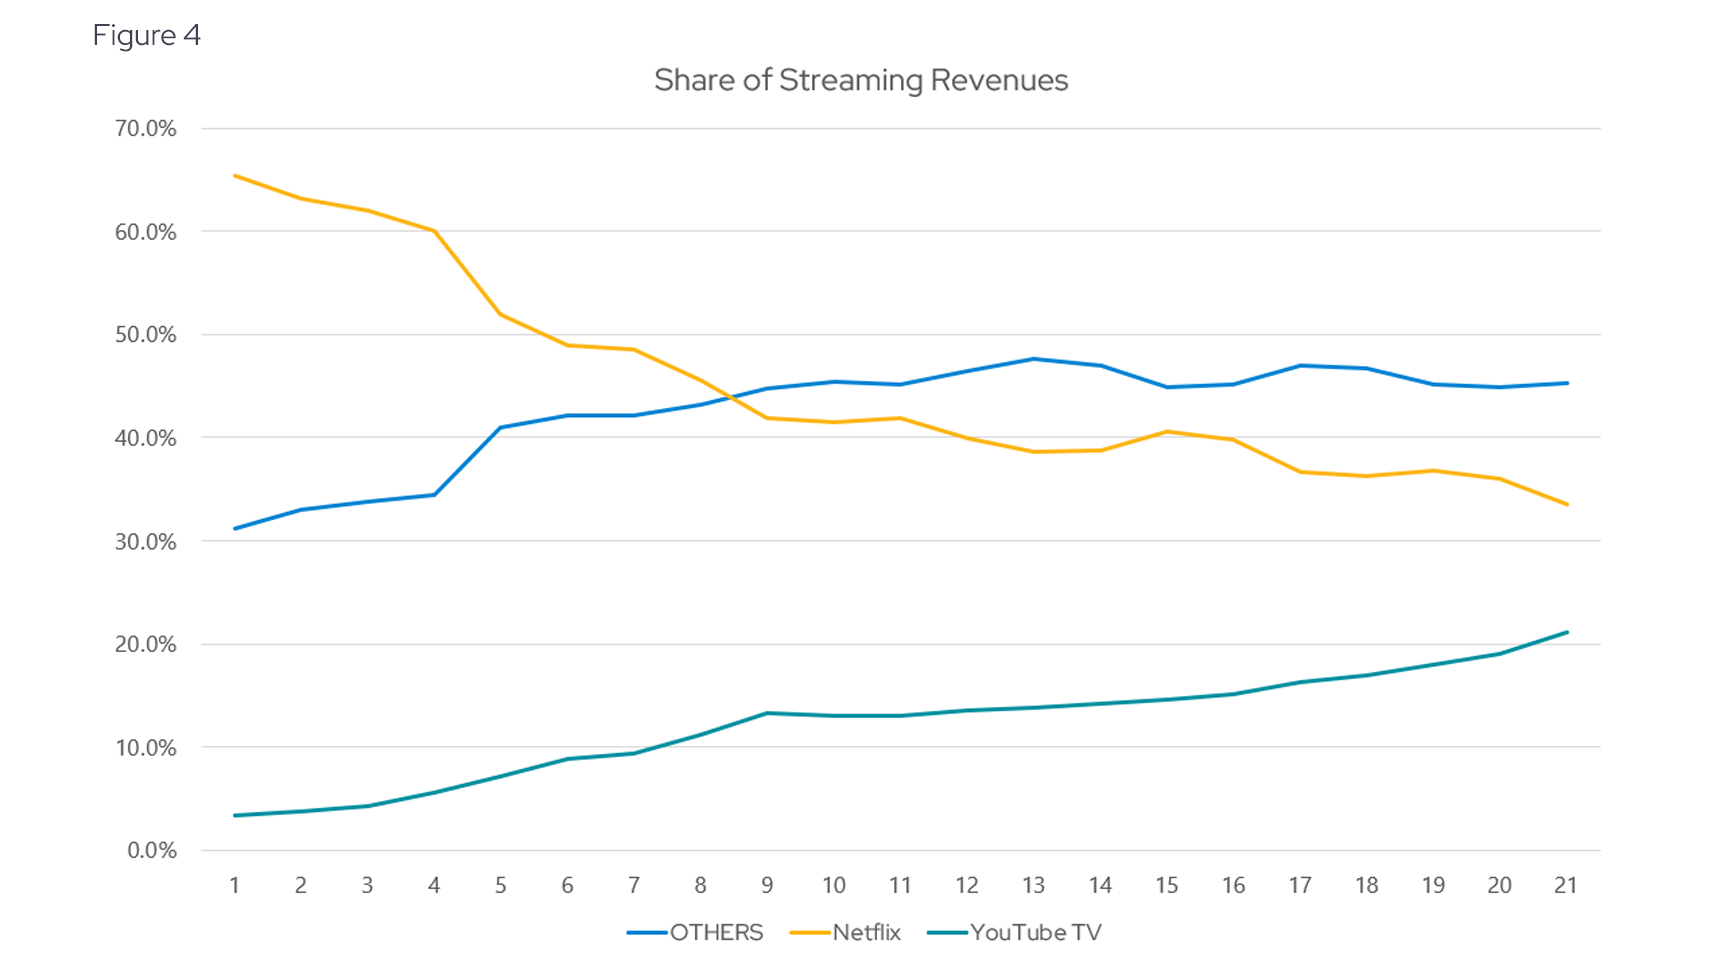
However, its invincibility is not guaranteed. In Figure 2, you can see that Netflix still commands the largest share of streaming expenditures, its supremacy has been gradually eroding. With the entry of competitors like Disney Plus and Paramount Plus, which are heavily investing in content and infrastructure, Netflix is increasingly sharing the streaming revenue pie with formidable rivals. Notably, platforms such as Disney Plus, YouTube TV, and Hulu have made significant inroads, reducing Netflix's share of spending from 70% to just over 30% (see Figure 4).
Average subscription prices are on the rise
The average transaction price, serving as a proxy for monthly subscription rates, is crucial for businesses, particularly in the competitive streaming service market. Given the vast array of choices available to consumers, maintaining and adjusting average prices is vital.
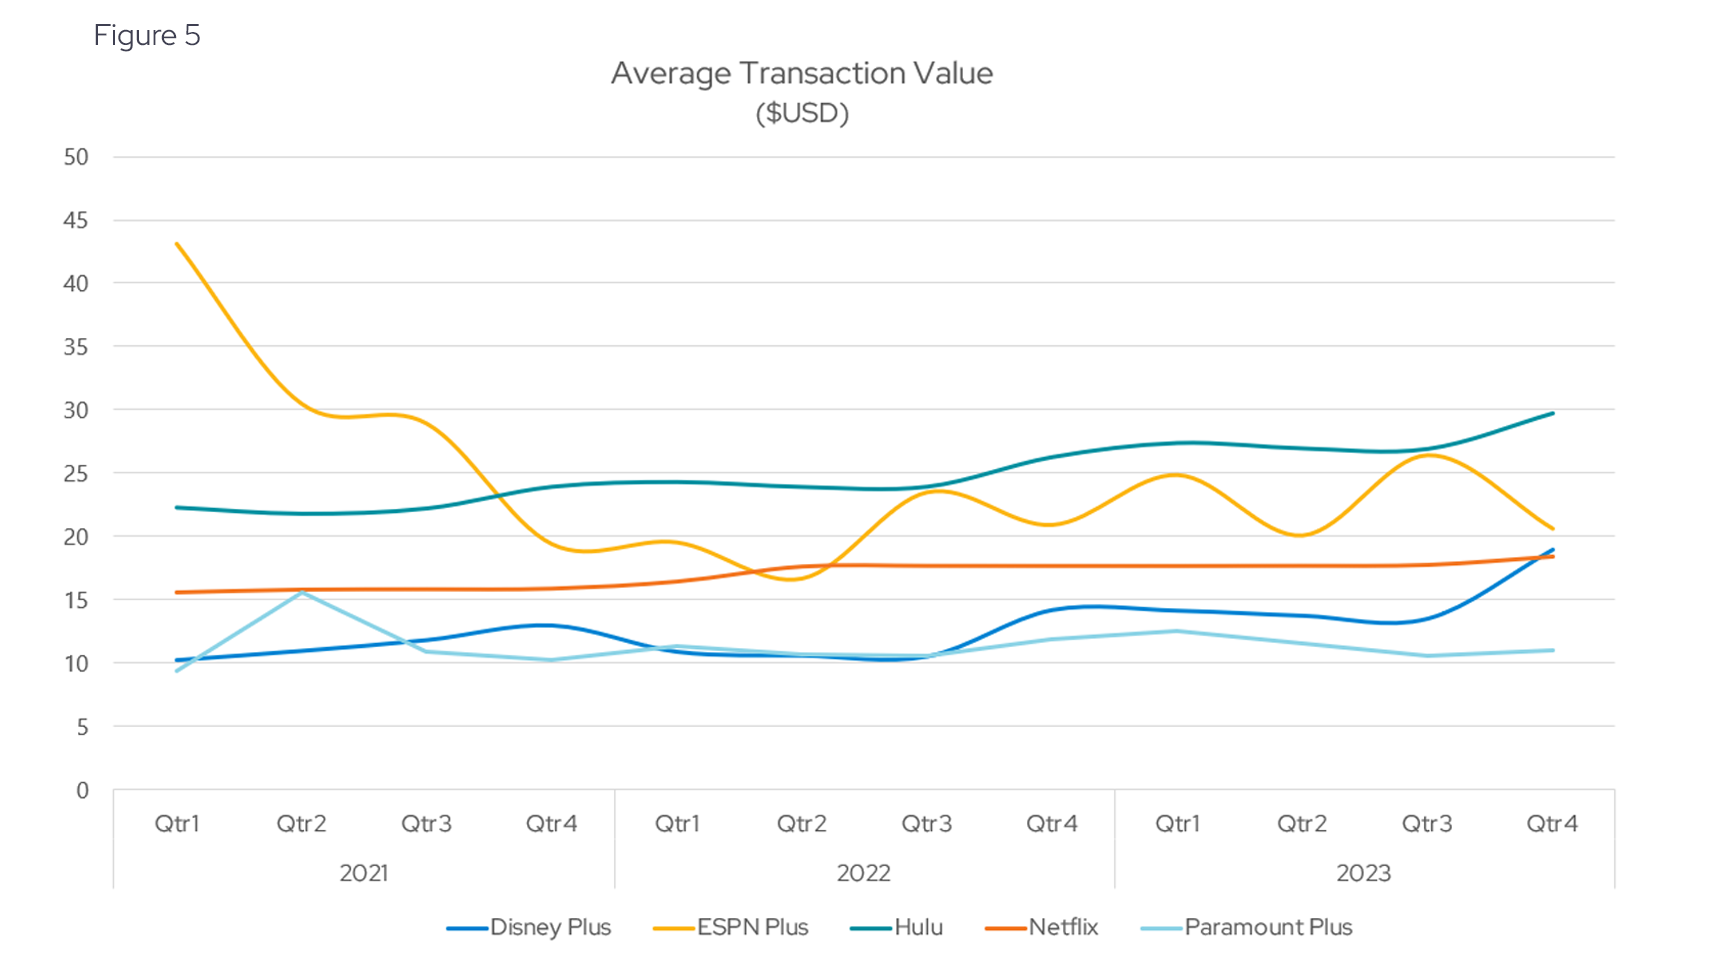
In Figure 5, the data suggests that, with the exception of ESPN Plus, most streaming brands have successfully increased their average transaction prices, outpacing inflation rates. A standout in this landscape is Disney Plus, which has impressively doubled its average transaction amount within three years of its launch on November 12, 2019. However, it's important to approach average transaction data with caution, especially considering the impact of bundling on these figures. Bundling can skew the average transaction size, a factor particularly relevant to services like Hulu, Disney Plus, and ESPN.
Winning customers and keeping them
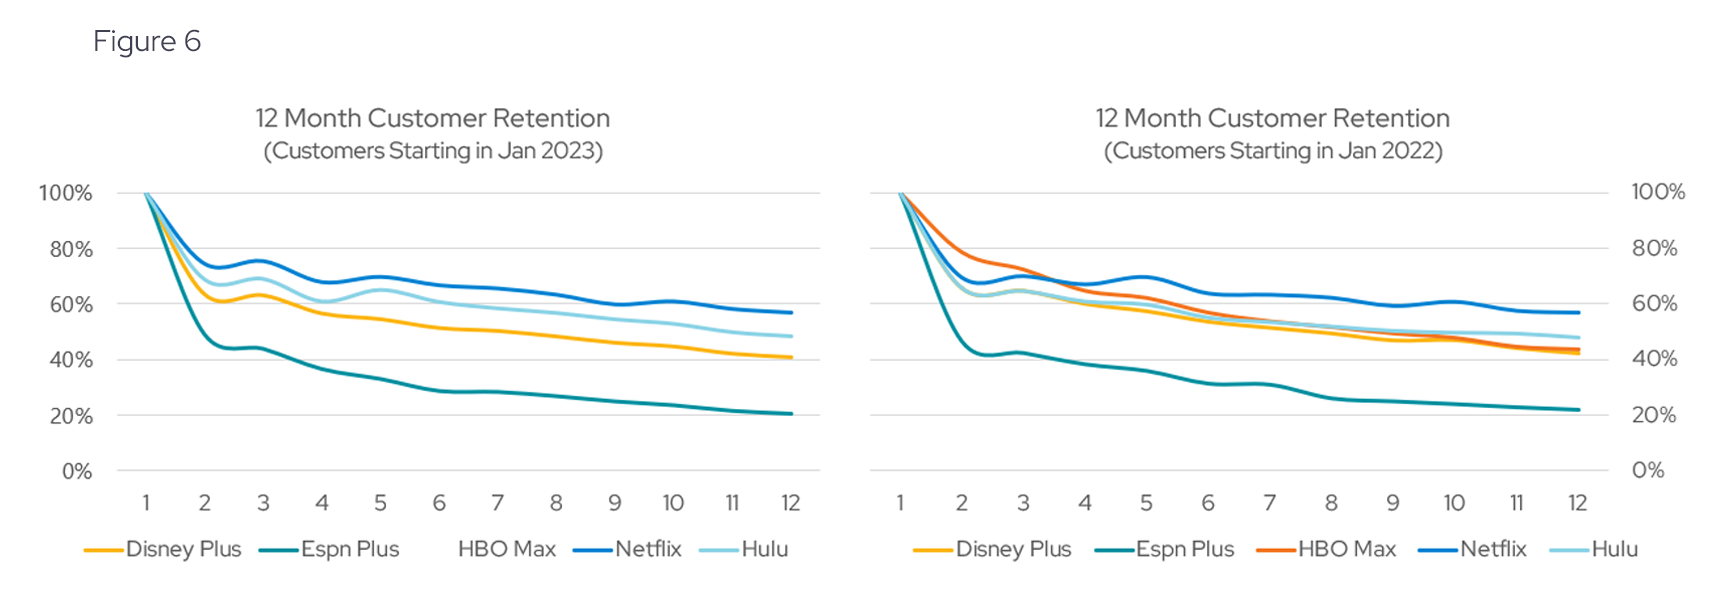
Retention is crucial for streaming services because it measures their ability to keep subscribers amidst a plethora of alternatives. Netflix stands out in this domain, showcasing its strength not just in attracting, but also in maintaining its subscriber base (see Figure 6). Although the pace of acquiring new subscribers in the U.S. may have decelerated, suggesting market saturation, Netflix's retention rates remain superior to those of its competitors, underlining the service's enduring appeal and customer loyalty.
Leveraging data to unlock competitive advantages
The landscape of content consumption is evolving swiftly, with streaming apps emerging as the new arena for competition. For investors aiming to remain ahead of the curve in this dynamic industry, access to high-quality data is crucial. This data not only provides an overview of the streaming market but also offers detailed insights into consumer preferences at a brand-specific level. As the streaming sector becomes increasingly competitive, investors equipped with this information may be able to better understand market dynamics, competitive standings, and spending patterns, positioning them to make informed decisions.
Envestnet | Yodlee: Data + Intelligence
The analysis in this article is based on an Envestnet | Yodlee dataset comprised of de-identified US credit and debit card transactions. Yodlee Merchant, Retail, Shopper, and Spend Insights utilize de-identified transaction data from a diverse and dynamic set of millions of accounts to identify patterns and context to inform spending and income trends. The trends reflect analysis and insights from the Envestnet | Yodlee data analysis team. By combining data with intelligence – connecting vast amounts of actual de-identified shopping data with state-of-the-art analytics and machine learning – Envestnet | Yodlee provides visibility into daily purchase behavior including transactions, customer lifetime values, and merchant/retailer shares.
Want to see how transaction data can inform your investment process?
Learn more about Envestnet | Yodlee Merchant and Retail Insights and get a free demo from a sales representative.