Investors are drawn to luxury retail for three main reasons. First, the sector offers resilience during downturns or economic uncertainty. While some brands inevitably fare better than others, investors are aware of the benefits these brands afford them during changing market cycles. Additionally, luxury retailers tend to have high margins, and brand loyalty which contribute to generally strong performance over the last decade leading up to the most recent holiday season.
Recent data shows that spending patterns have changed and the luxury retail sector in general has cooled off from the high post COVID recovery. As a result, some high-end fashion brands have warned about missing their projected sales targets and 2024 is promising to be a year of divergence in the performance of luxury brands.
This article explores the spending trends for a select group of luxury retailers as evidenced by de-identified spending trend data from Envestnet® | Yodlee®. Looking at transactions from millions of accounts, we can get a view into how spending preferences are evolving in high-end retail. In this analysis we examined the direct to consumer (DTC) and e-commerce transaction data for the following brands: Balenciaga, Burberry, Chanel, Christian Dior, Gucci, Hermes, Louis Vuitton, Prada, and Versace.
The luxury spending rollercoaster
Even though total spending on luxury brands has increased compared to pre-COVID years, the growth has stalled and reversed in the most recent periods, as evidenced by Figure 1.
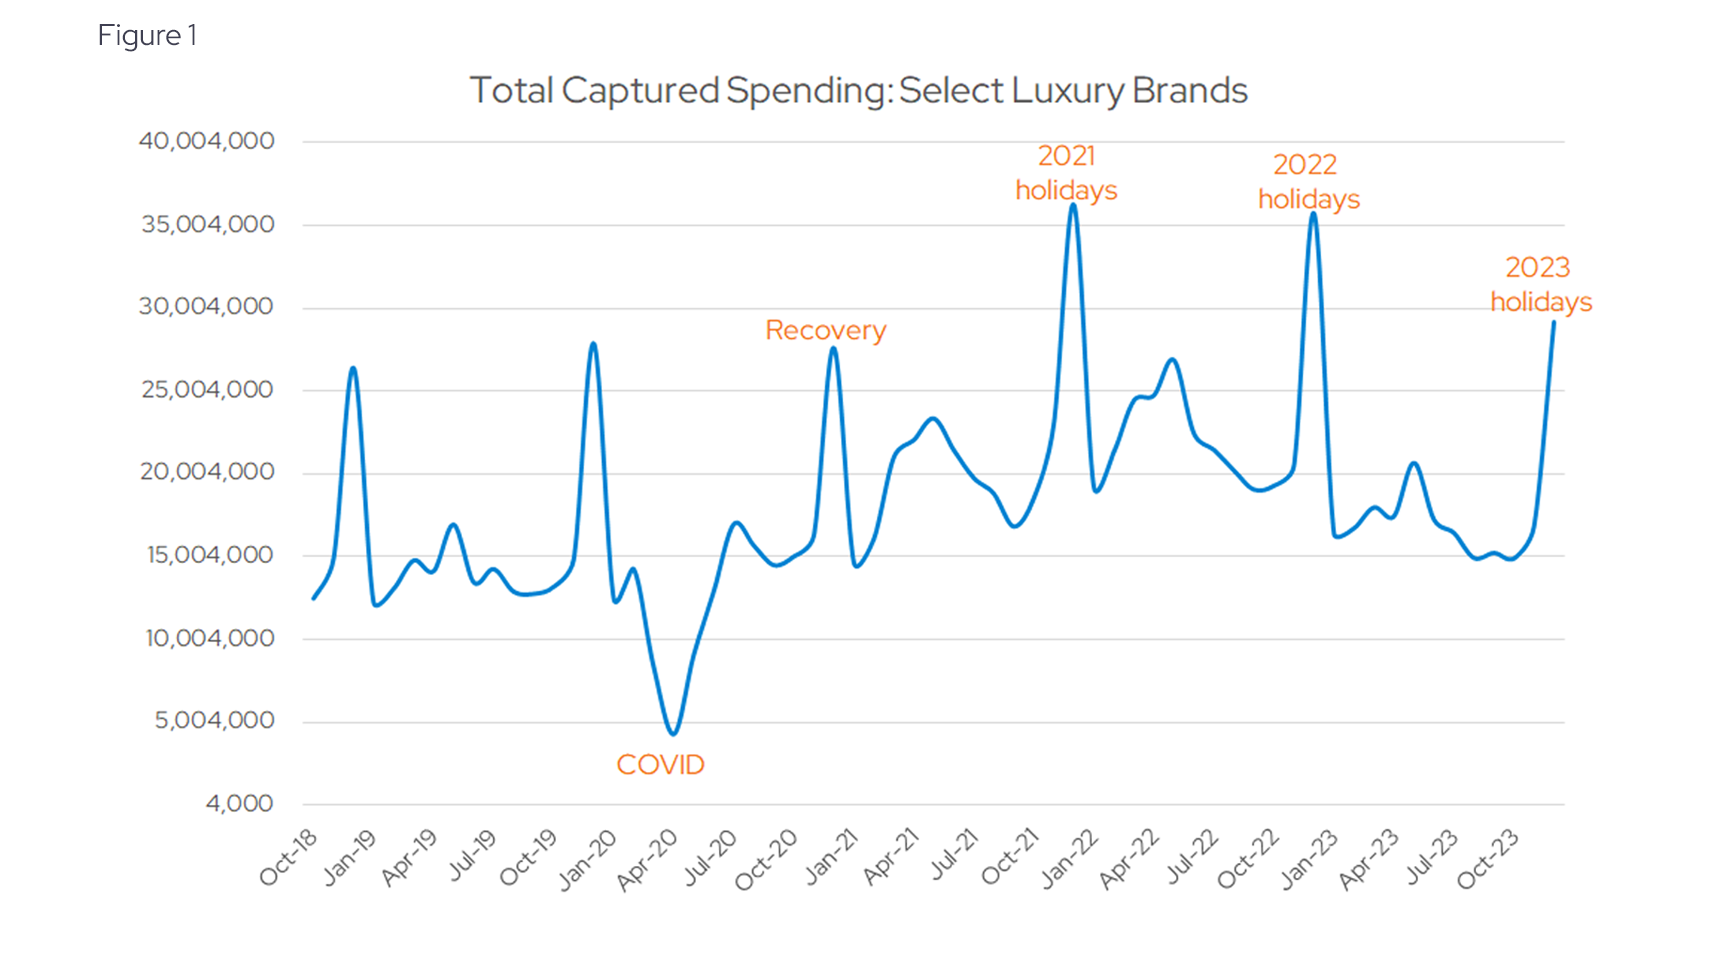
Total monthly spending on these brands peaked in 2021 during the holiday season and has struggled to reach the highs again, narrowly beating 2020 levels during the past holidays. Some of the reasons for this are macro-driven. The current economic picture is complex and some spending trends point to more conservative habits developing out of post-COVID “vengeance shopping.” We can see the trend more clearly on a year-over-year (YoY) basis.
Figure 2 shows the same aggregate spending data but takes the seasonality out by comparing each monthly aggregated figure to the same month one year ago.
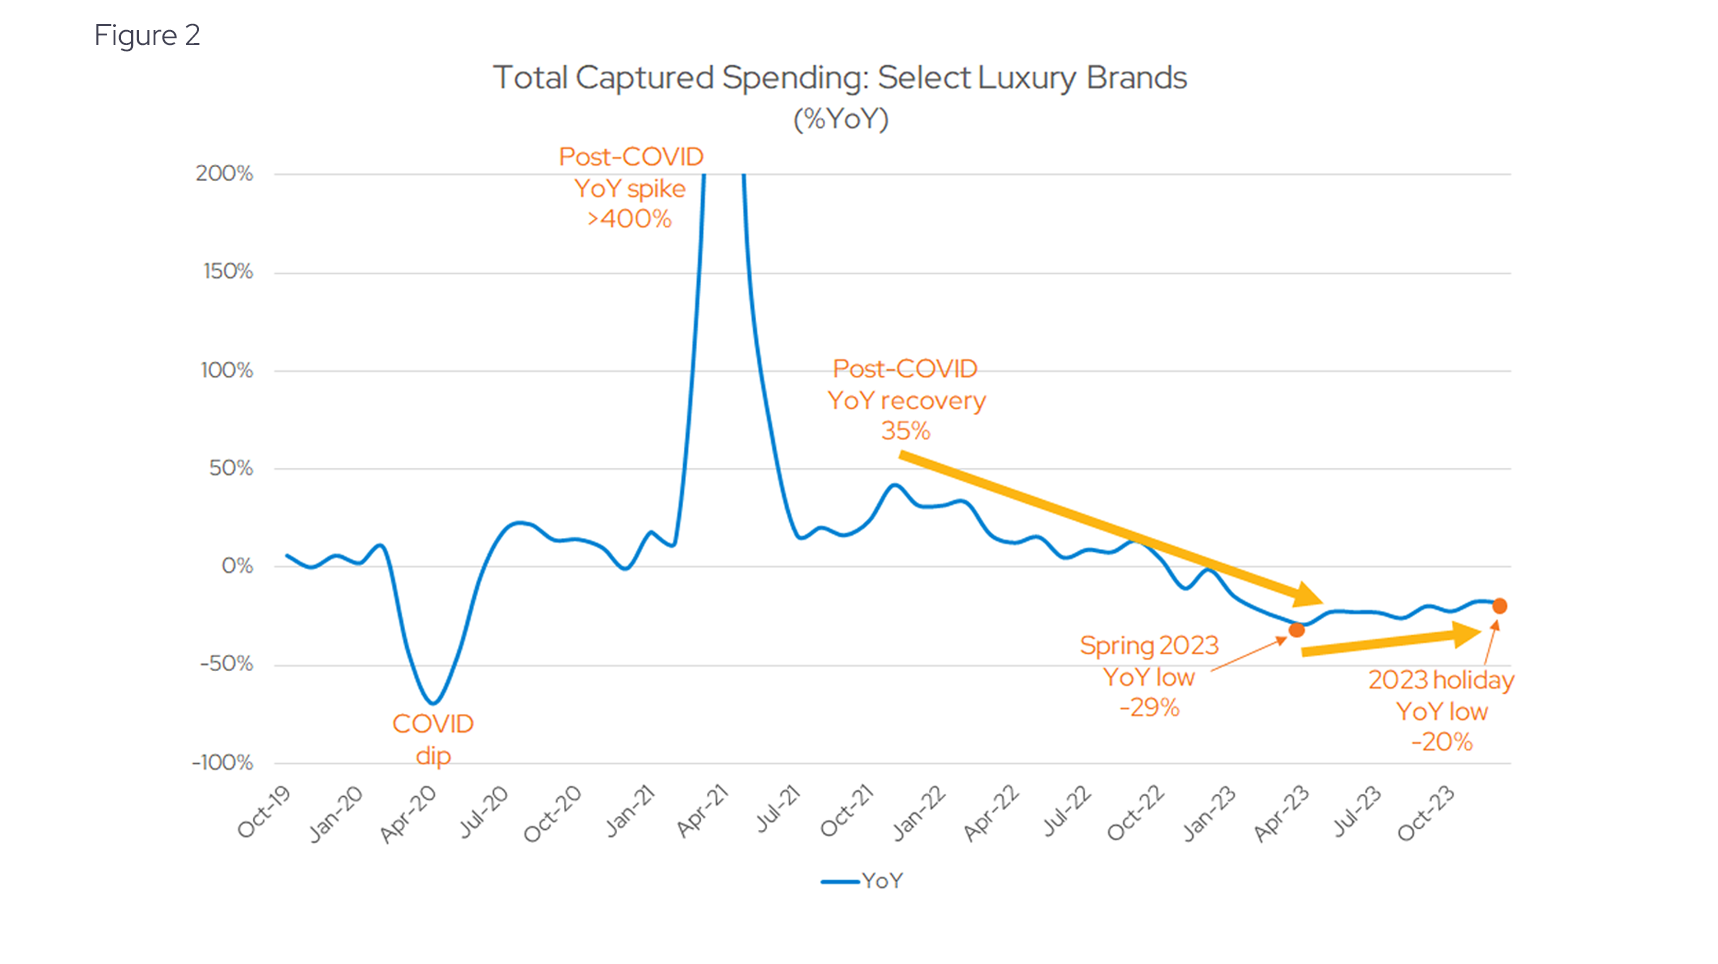
Growth peaked in 2021 and has been declining (down from +35% to -29% YoY, not counting the post-COVID spike) until April of 2023. Although it has moved up since, current levels are still 20% below where they were during the prior holiday season. This is particularly relevant for retail given how much revenue is generated around the holidays as a percent of annual sales.
This data shows that while there was a recovery to the pre-COVID baseline, it is necessary to perform analysis on an individual brand basis to understand the how the trends are affecting each brand separately.
Winners and losers in the fashion wars
Clearly, not all brands are equal in their market share or positioning, and this is where granular data can shed light on the divergence in performance we mentioned earlier.
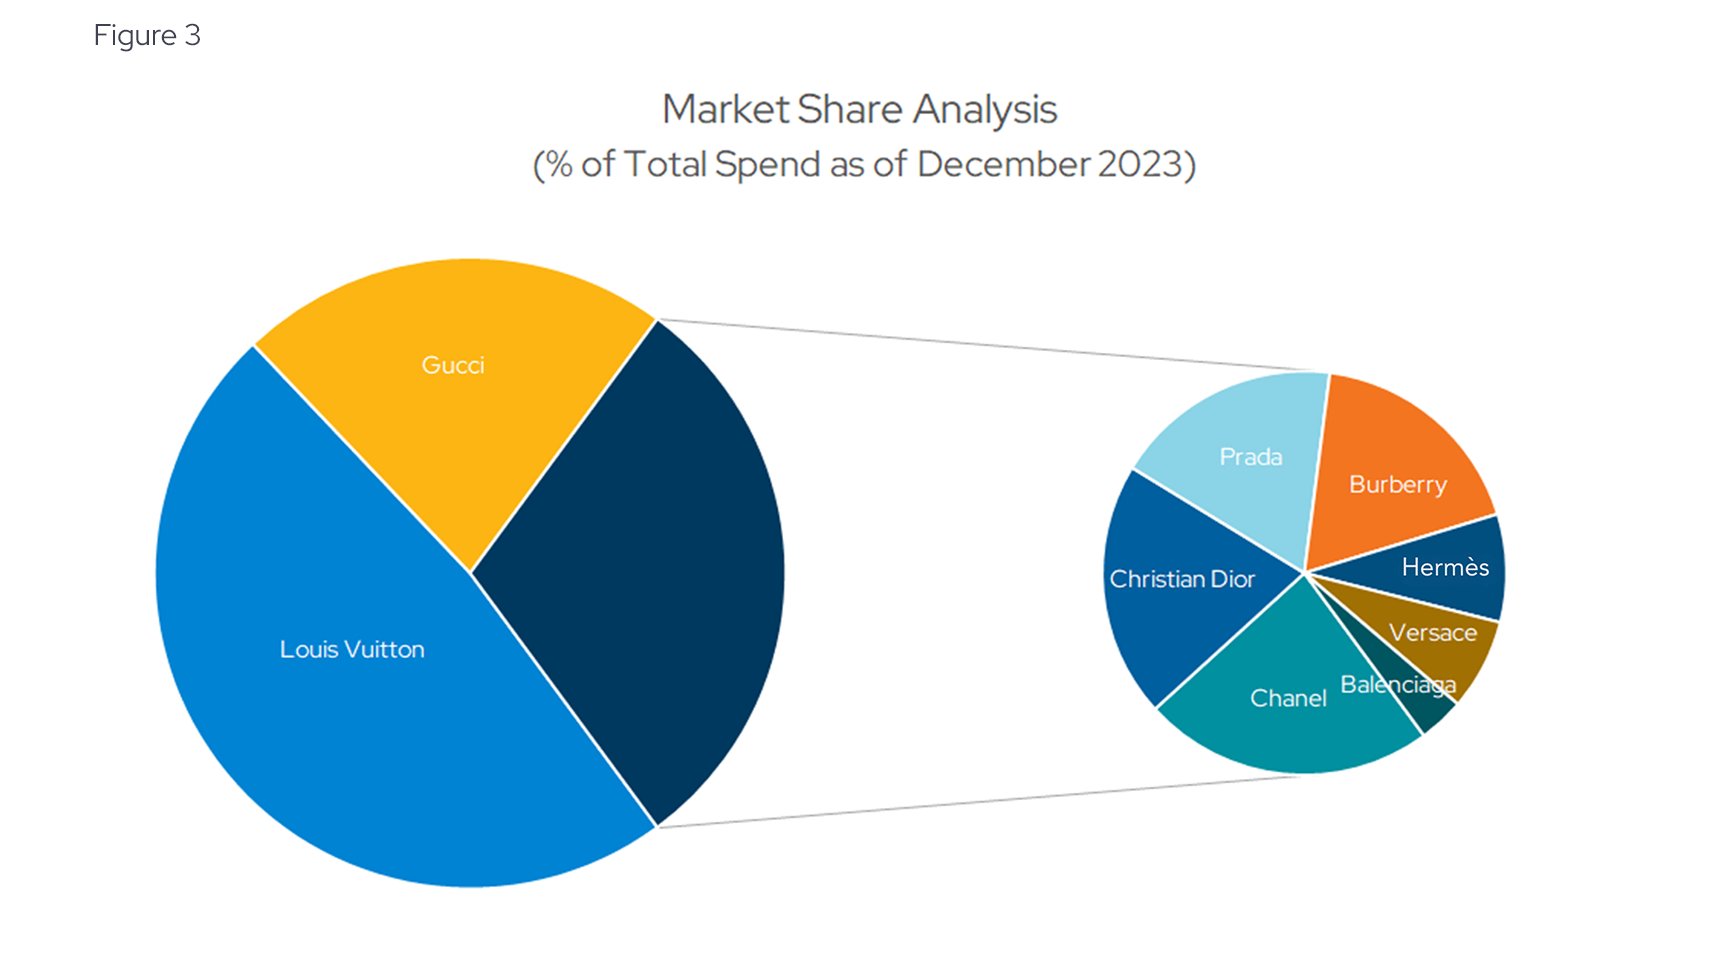
As Figure 3 shows, the top two brands – Louis Vuitton and Gucci – make up a whopping 70% of market share as of our latest snapshot data for December 2023. The other 30% are split more equitably amongst the remaining luxury brands such as Prada, Christian Dior, Burberry, and Chanel. Some brands have been able to increase market share, some were stable, while others face a long-term decline.
Figures 4 and 5 show the historical market share for brands that have experienced the most change in the past five years.
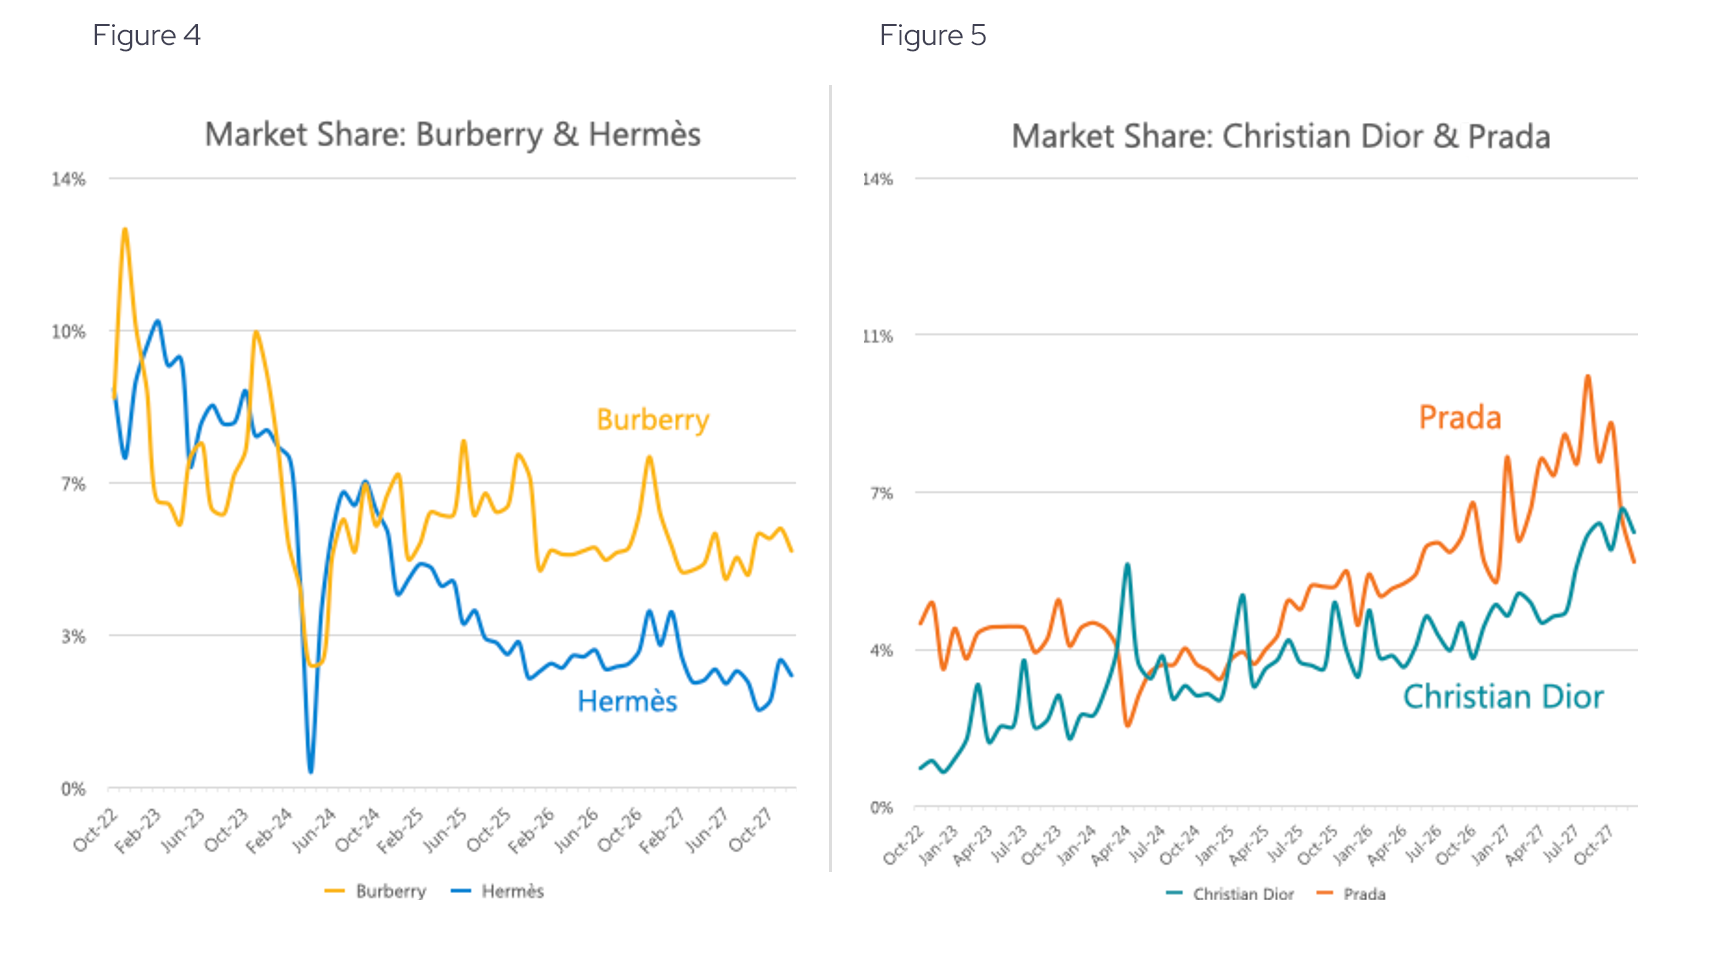
Some luxury brands like Burberry and Hermes slipped in market share, while others proved more resilient such as Christian Dior and Prada, who gained relative share. The leader, Louis Vuitton, has been range-bound taking between 40-50% of the group’s spending, and Gucci has shown similar stability at approximately 23% of total spend.
Overcoming value stagnation
Revenues can be viewed as the product of two parts: the number of transactions and the average transaction size or order value for those transactions. Average order values (AOV) have remained stubbornly flat at $800 on average for the group of brands we analyzed, signaling the market’s hesitancy to accept inflation in luxury. Again, the devil is in the details and not all brands fared equally as we can see in Figure 6.
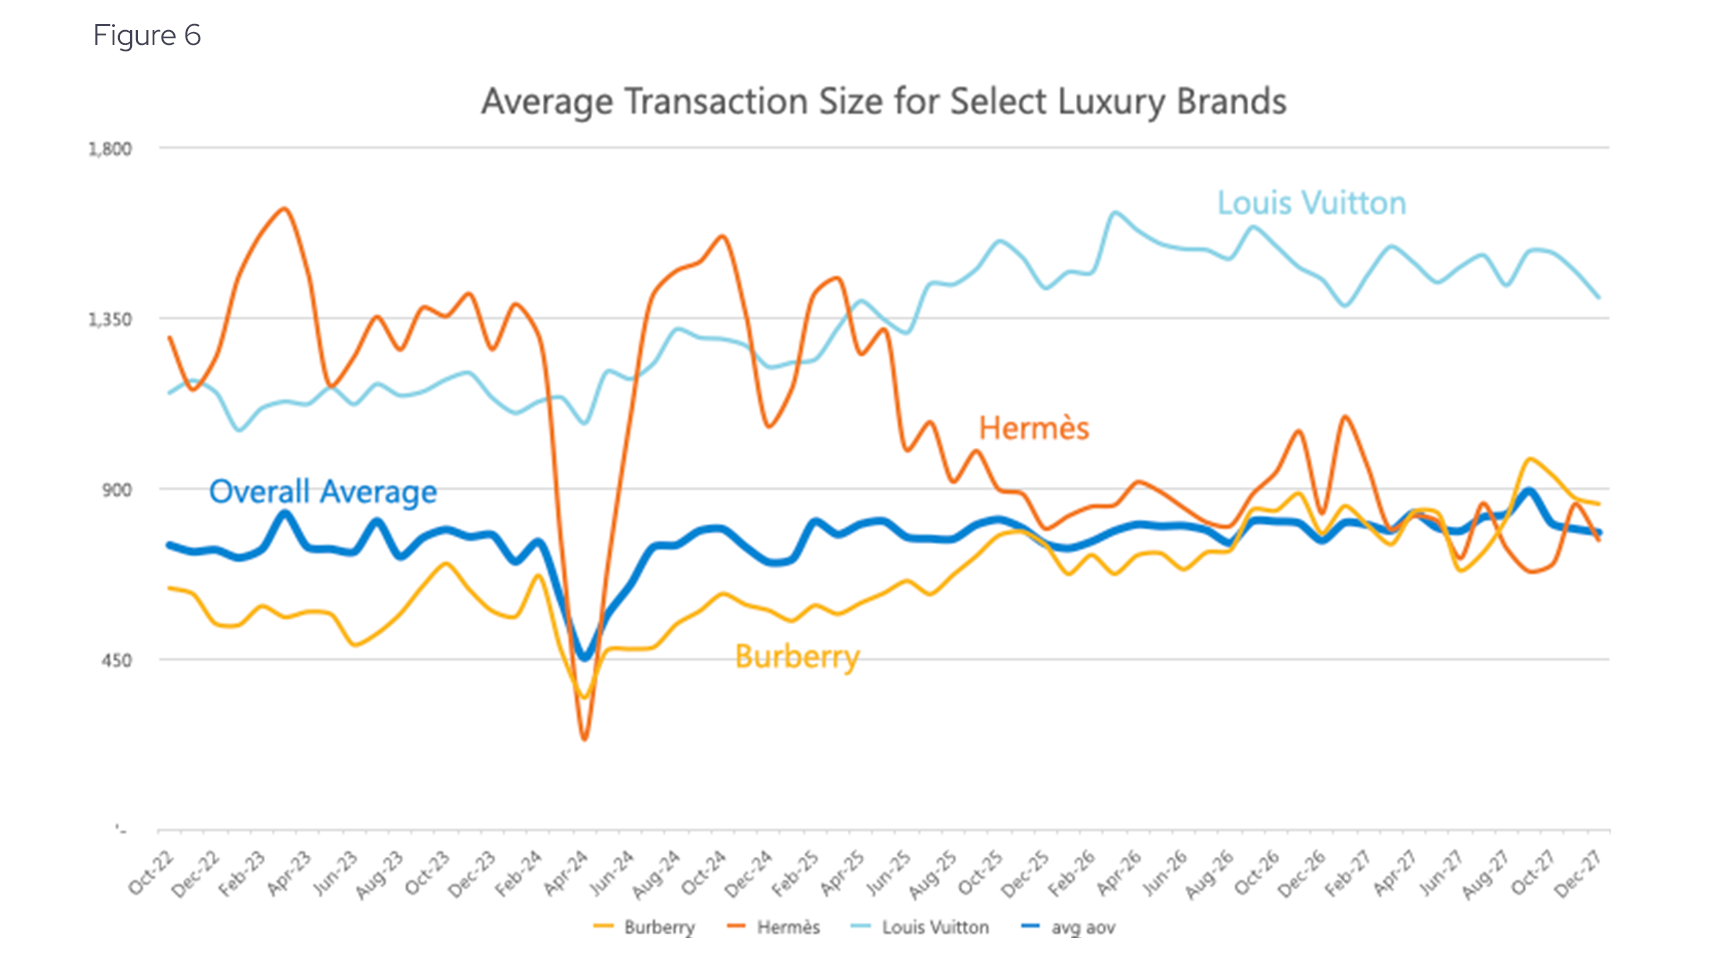
The industry leader, Louis Vuitton has increased prices since 2018 but come off its 2022 peaks in average transaction amounts. Other brands like Hermes have reduced prices, while others remained largely stable.
More dollars, less transactions
A relationship between AOV and the number of transactions inform willingness to spend in light of higher prices. Figure 7 shows a plot of AOV on the x-axis and number of transactions on the Y for the years 2021 and 2023.
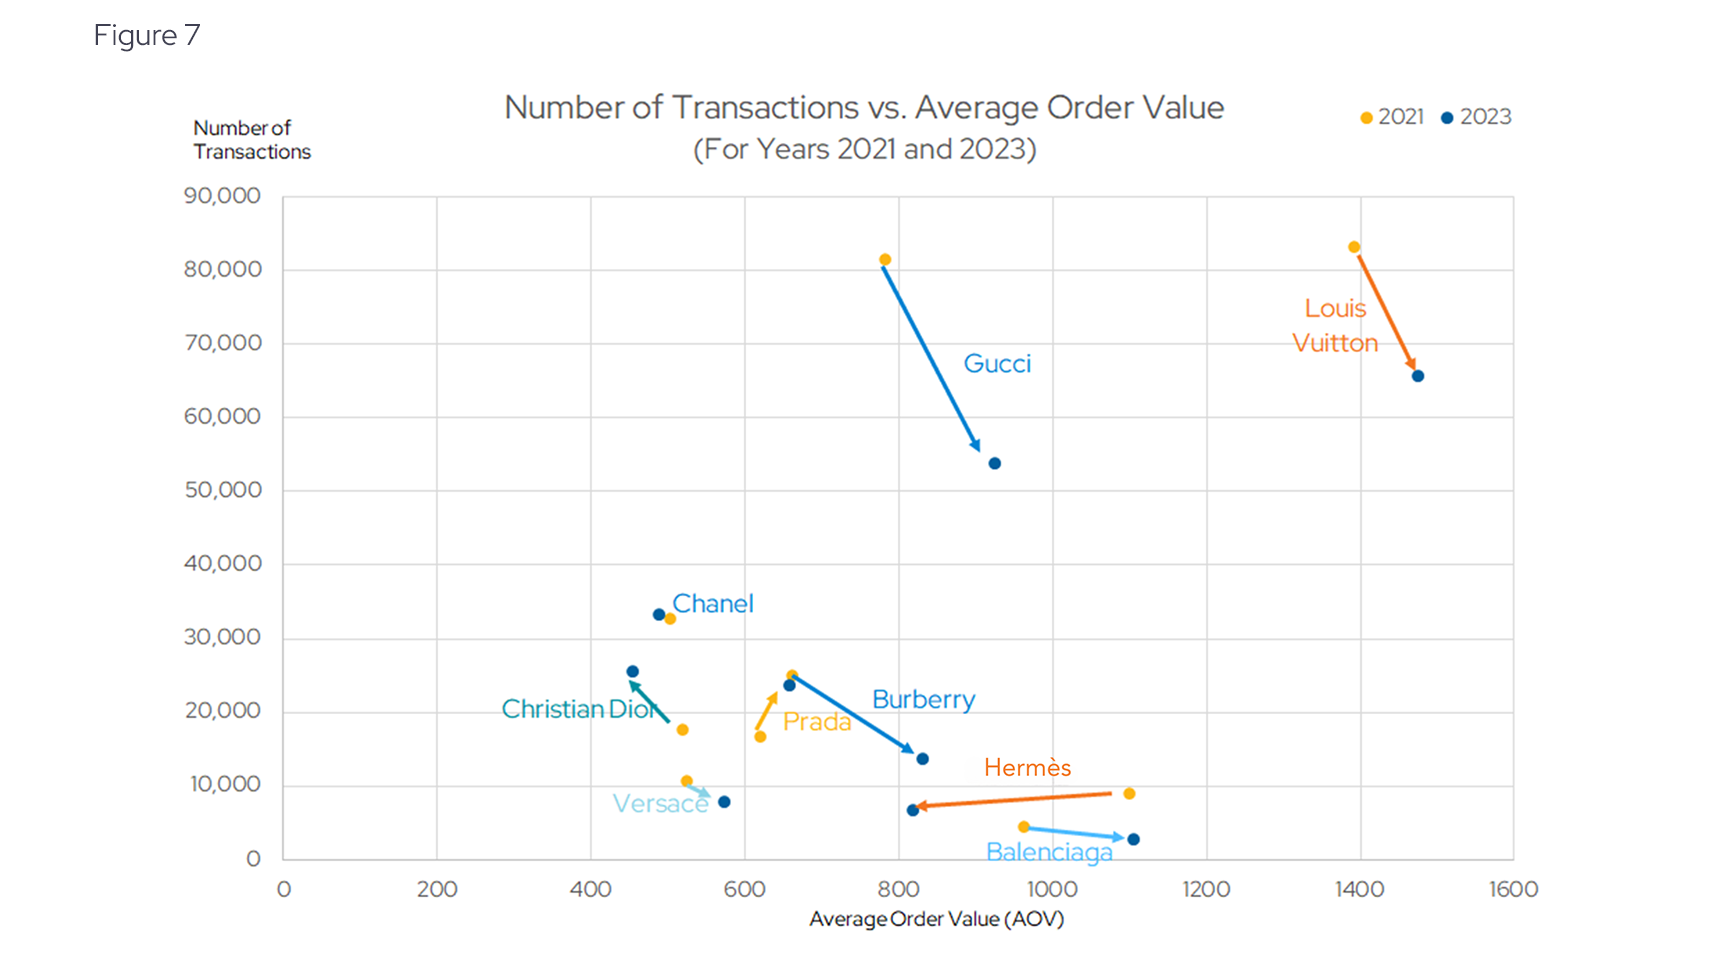
Figure 7 helps us gauge the market’s appetite for brands increasing their prices. As mentioned before, evidence suggests that the market has not been receptive to inflation in luxury. One would expect that increasing prices leads to lower transaction counts, and generally this was the case. The two leaders, Louis Vuitton and Gucci have seen increased AOVs with a corresponding decline in order volumes. These two forces have seemed to balance out and preserve their respective market shares. Christian Dior and Prada increased their shares through different paths, the former having to lower prices to increase transactions, while the latter seemed to defy gravity by increasing both AOV and transaction counts (albeit slightly). Hermes stood out as having both declining AOVs and transactions.
High stakes for high fashion
While the retail luxury sector is still strong, it is showing signs of slowing and not all brands have proven as resilient as investors have come to expect. This underscores the importance of analysis using granular data that can help uncover future divergence in the performance of these and other companies. A lot remains to be seen as we move forward into the year and this holiday season will be closely watched by investors looking to identify the leaders and laggards in this highly lucrative industry.
Envestnet | Yodlee: Data + Intelligence
The analysis in this article is based on an Envestnet | Yodlee dataset comprised of de-identified US credit and debit card transactions. Yodlee Merchant, Retail, Shopper, and Spend Insights utilize de-identified transaction data from a diverse and dynamic set of millions of accounts to identify patterns and context to inform spending and income trends. The trends reflect analysis and insights from the Envestnet | Yodlee data analysis team. By combining data with intelligence – connecting vast amounts of actual de-identified shopping data with state-of-the-art analytics and machine learning – Envestnet | Yodlee provides visibility into daily purchase behavior including transactions, customer lifetime values, and merchant/retailer shares.
Want to see how transaction data can inform your investment process?
Learn more about Envestnet | Yodlee Merchant and Retail Insights and get a free demo from a sales representative.