Subscription services have transformed our access to everything from entertainment to groceries, thriving on the allure of convenience and personalization. The idea of effortlessly receiving goods at our doorstep or streaming new content from the comfort of our couch is appealing. Yet, the ease of signing up has led to a clutter of underused subscriptions. With the bite of inflation and a growing awareness of spending on unused services, consumers appear to be scrutinizing their budgets for possible savings.
It seems you can get a subscription to almost anything these days. This report draws on data across various categories, including beauty and personal care, books, clothing, gaming, health and fitness, meal kits, online learning, and streaming services, using Envestnet® | Yodlee®'s extensive collection of de-identified retail transaction data.
Increased spending on subscriptions
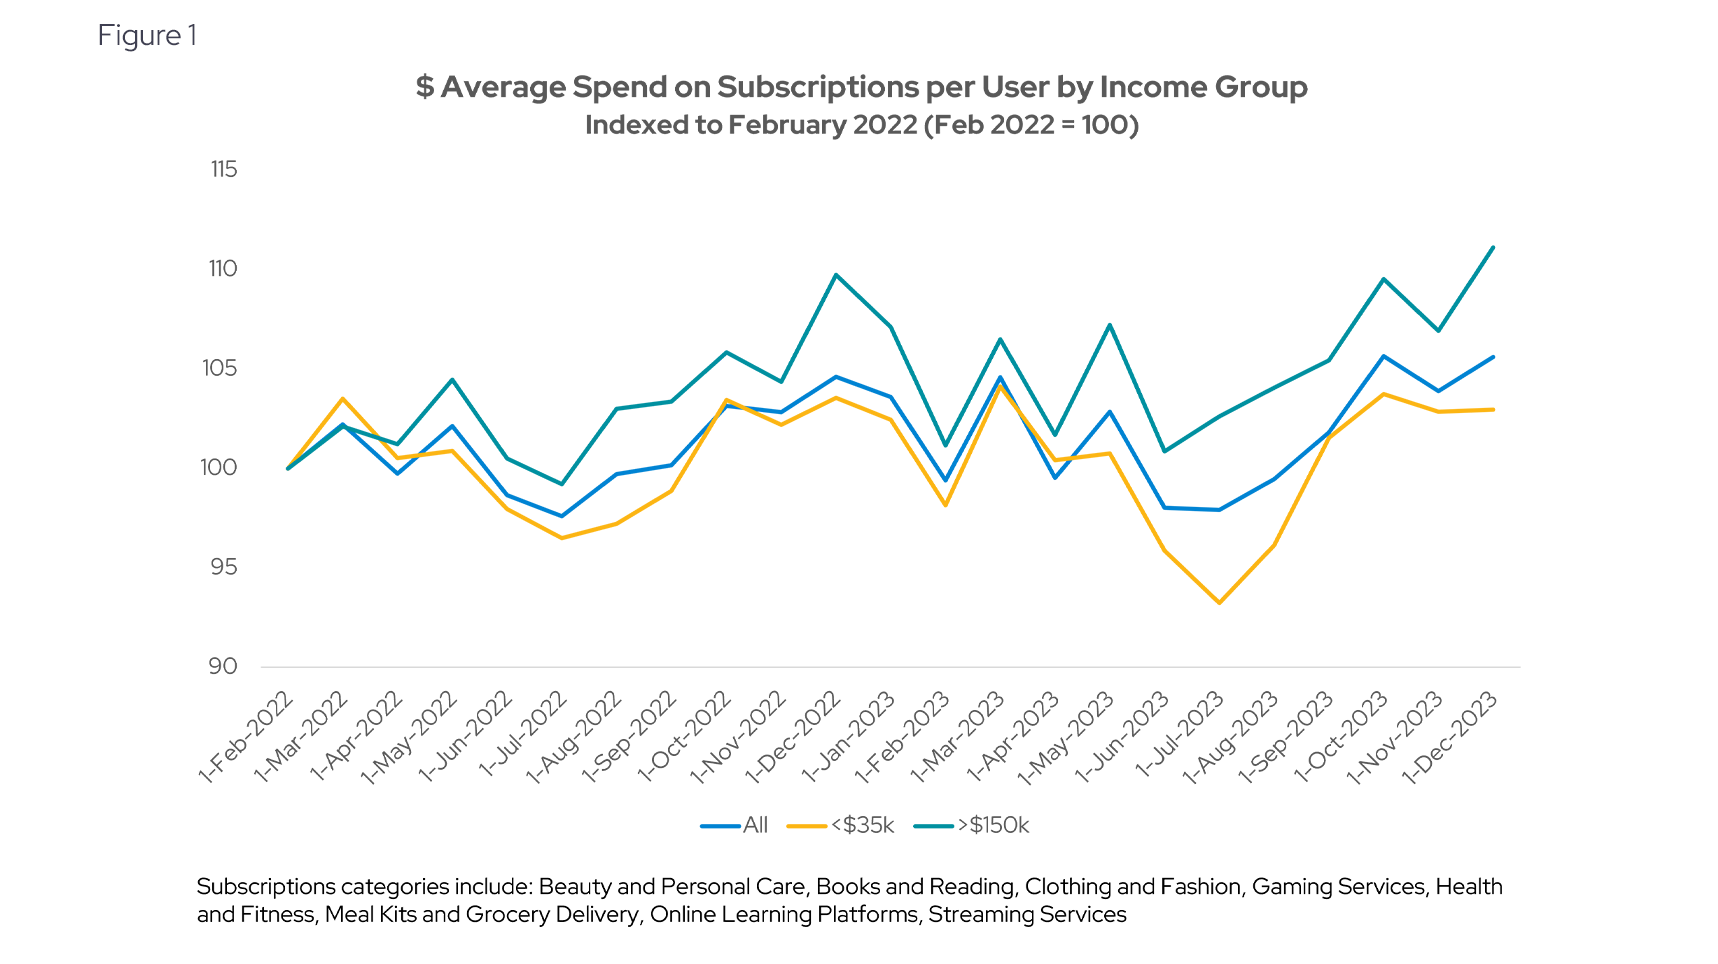
Yodlee data shows that all income brackets saw increases in spending on subscriptions in 2023, with the highest income group (>$150k) outspending the lowest income group (<$35k), as might be expected (see Figure 1). The average spend per user for all three groups peaked in December 2022 and again in March, May and October of 2023. Spending reached an all-time high for the highest income group and the overall group in December 2023.
These trends align with the National Retail Federation (NRF), which reported that consumer spending trends showed a slowdown in the subscription frenzy after the peak during the pandemic, but that US subscription ecommerce sales are projected to continue seeing double-digit growth over the next few years, reaching $43.13 billion by 2024.
Increased spending per user
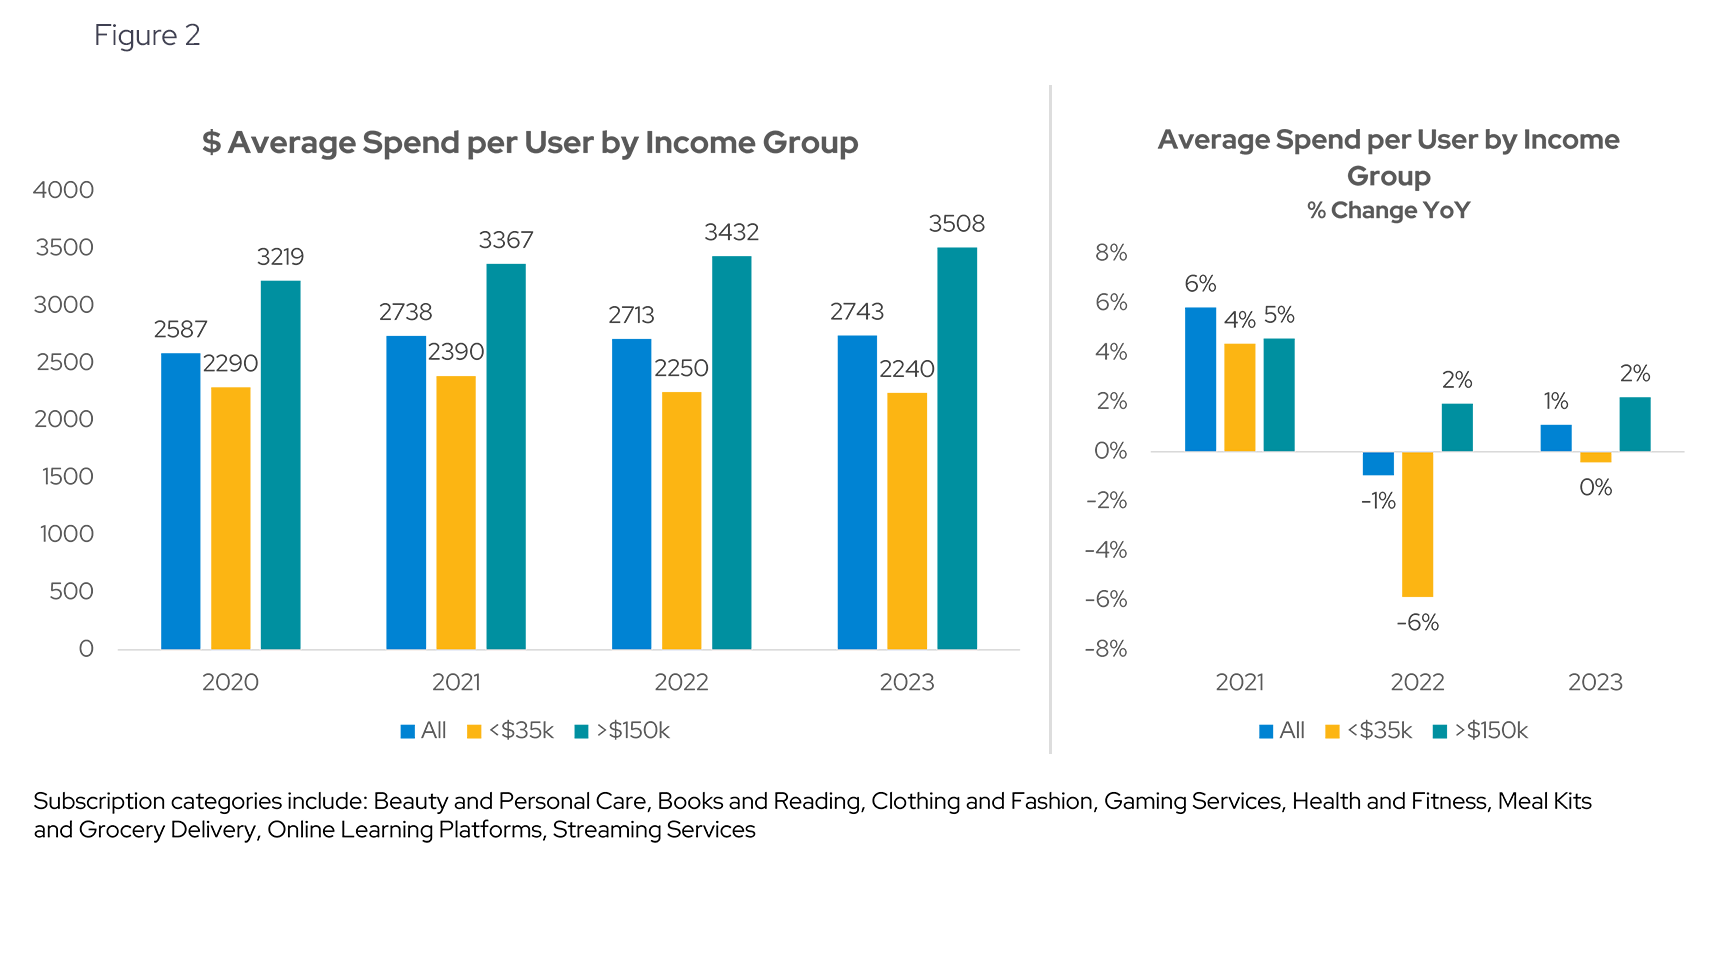
Looking across all income groups, the average spend per user on subscriptions has increased 6% from 2020 to 2023 (see Figure 2). The increase is higher for the highest income group, which increased spend per user by 9% in that time period. The lowest income group increased spend by 4% between 2020 and 2021 but then reined in spend in 2022 and 2023.
Decreasing number of subscription accounts per user
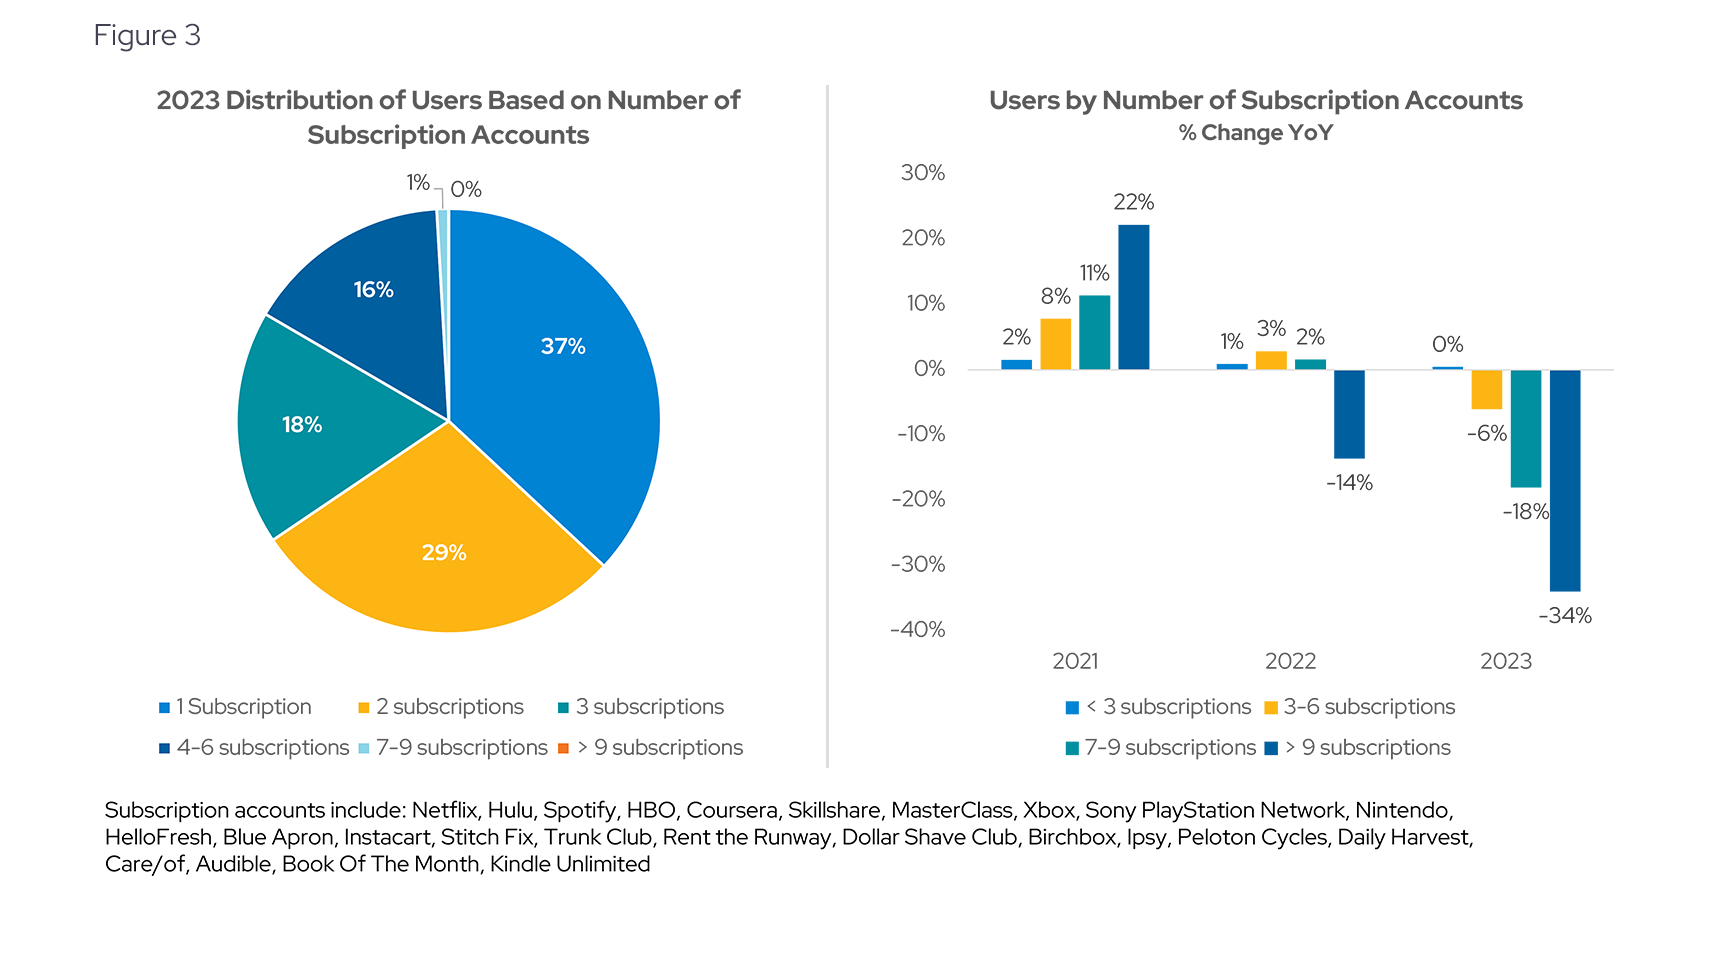
Looking at de-identified transaction data by user, we can see that 37% of consumers have only one subscription account. More commonly, consumers have anywhere from 2-6 subscriptions. A report from Yahoo Finance that states that consumers have an average of 4.5 subscriptions, with the average American spending $924 per year on subscription services, with streaming being the most popular type of subscription.
A survey from Chase indicates that 33% of consumers plan to cut back on subscriptions within the next 6 months and 22% feel overwhelmed by the number of subscription services they subscribe to. This oft discussed “subscription fatigue” can be seen in year-over-year changes in the number of subscription accounts per user. The Yodlee data shows there were increases in all subscriptions from 2020 to 2021. Then we see a big drop of 14% reduction of users with greater than 9 subscriptions. That dropped even further in 2023 with an additional decrease of 34% year-over-year.
Check out our detailed blog post on subscription trends by category for a deeper dive on this topic.
Want to get ahead of consumer spending trends?
Subscribe to our research data blog for ongoing updates or reach out for a personalized, up-to-date view of Yodlee consumer spending data.
About Envestnet | Yodlee Merchant, Retail, Shopper, and Spend Insights
Envestnet | Yodlee Merchant, Retail, Shopper, and Spend Insights utilize de-identified transaction data from a diverse and dynamic set of data from millions of accounts to identify patterns and context to inform spending and income trends. The trends reflect analysis and insights from the Envestnet | Yodlee data analysis team. By combining data with intelligence – connecting vast amounts of actual de-identified shopping data with state-of-the-art analytics and machine learning – Envestnet | Yodlee provides visibility into a large set of shopping daily purchase behavior including, but not limited to, transactions, customer lifetime values, and merchant/retailer shares.
To learn more about Envestnet | Yodlee Merchant and Retail Insights and get a free demo, please contact an Envestnet | Yodlee sales representative.