Vacationers are packing their bags but tightening their purses
This summer, a whopping 82% of adults in the US are planning vacation trips. But that number is slightly off last summer’s levels. The trend seems to be impacted by the declining consumer confidence and economic uncertainty in the US. This lack of confidence has weighed down spending, as we mentioned in out recent piece exploring trends in the consumer retail sector. Falling confidence coupled with slower growth and stubbornly high inflation is also evidenced by a lack of growth in travel spending over the past two years, with a few rare exceptions, specifically in the online travel agency (OTA) space and cruises.
In this article, we analyze consumer spending data from millions of accounts sourced from the deidentified Envestnet | Yodlee transactions database, and explore trends in five different categories of travel: hotels, airlines, OTAs, cruises, and rental cars. Several companies from each category were chosen for the purposes of this analysis and the data is not all inclusive. We focus on the trends in spending, number of travelers, and the average order value (AOV) for each category.
Travel spending is robust heading into the summer but is off post-Covid peaks
Before zooming in, it helps to zoom out. Aggregating all the spending data for the selected group of companies we covered, we can see a strong, but range-bound demand for travel since 2022. Notably, the summer peaks have been flat to slowly decreasing for the past 18 months (Figure 1).
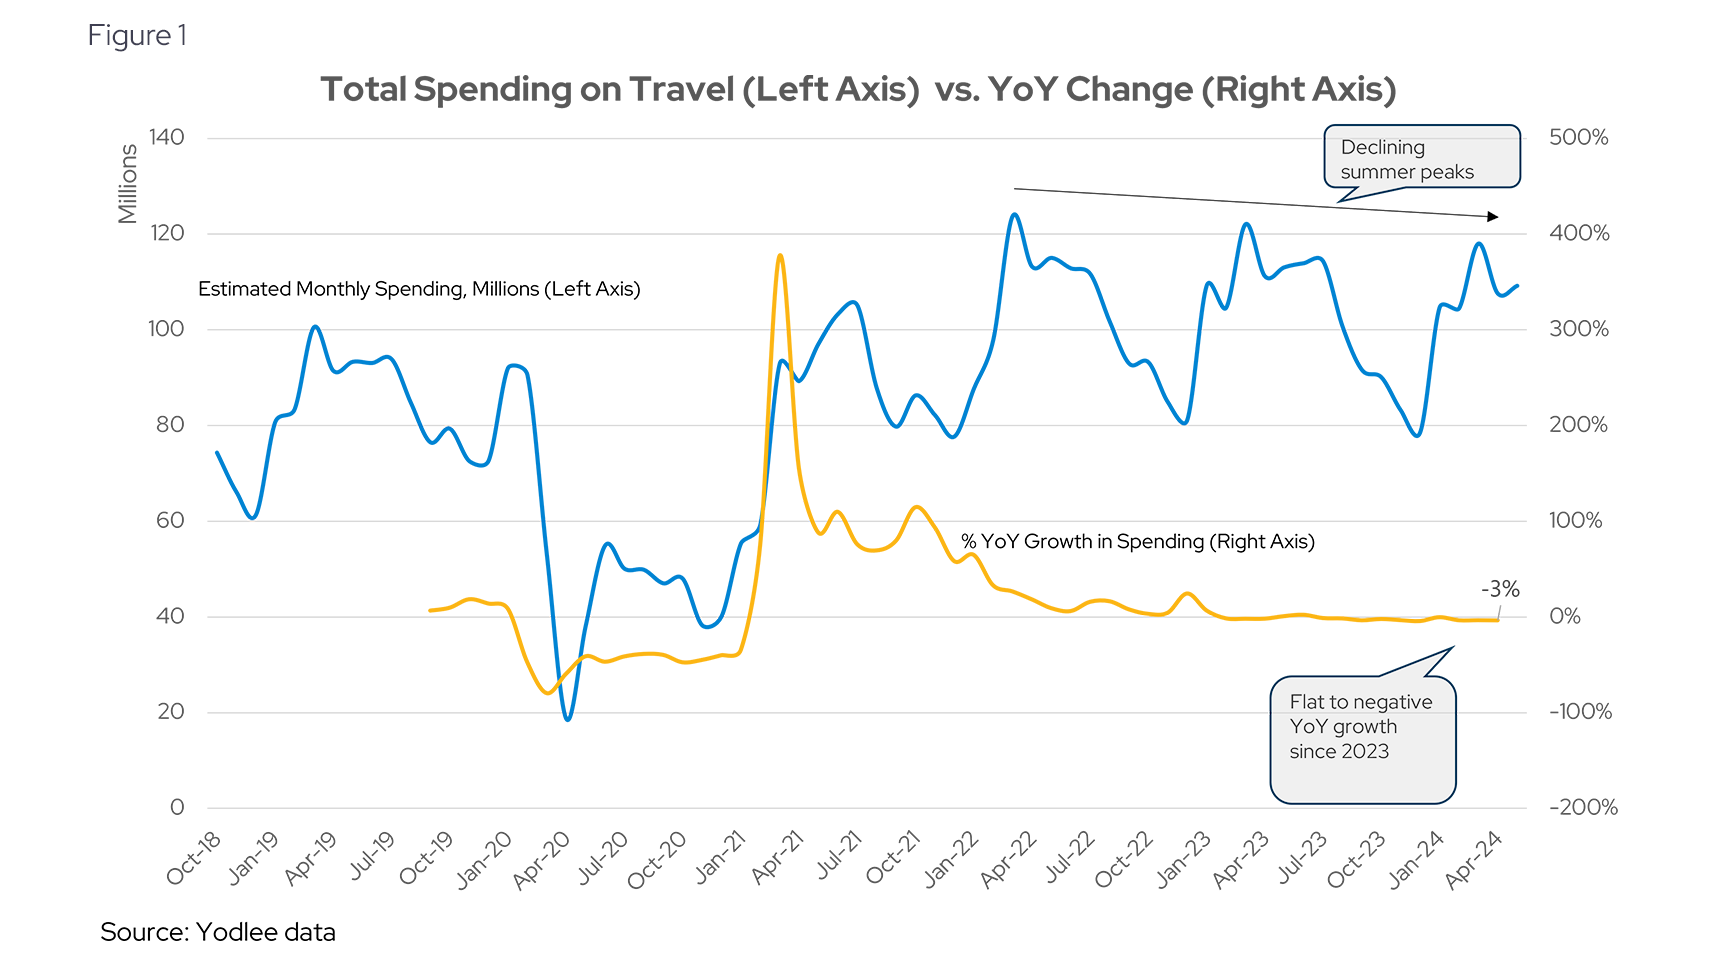
In Figure 1, the solid line shows the total aggregated monthly spending for all the companies we cover in this analysis. Note that each consecutive summer peak has been slightly below the previous for the past three summers. At the same time, the relative seasonal winter lows have been stable, showing resilience of travelers and the established new norm since the pandemic.
The dotted line in Figure 1 represents the year-over-year (YoY) growth of total spending on our select travel brands. This is calculated by taking each month’s total spending and dividing it by the same month last year. Hovering around zero since January 2023, growth has recently tipped below zero, as spending slowed by 3% YoY in May. Not all categories are slowing down, however. A few bright spots remain resilient, and some are even showing modest signs of growth. Let’s take a look at the breakdown of spending by categories.
Airlines, hotels, and car rentals shrink while cruises and OTAs offer some stability
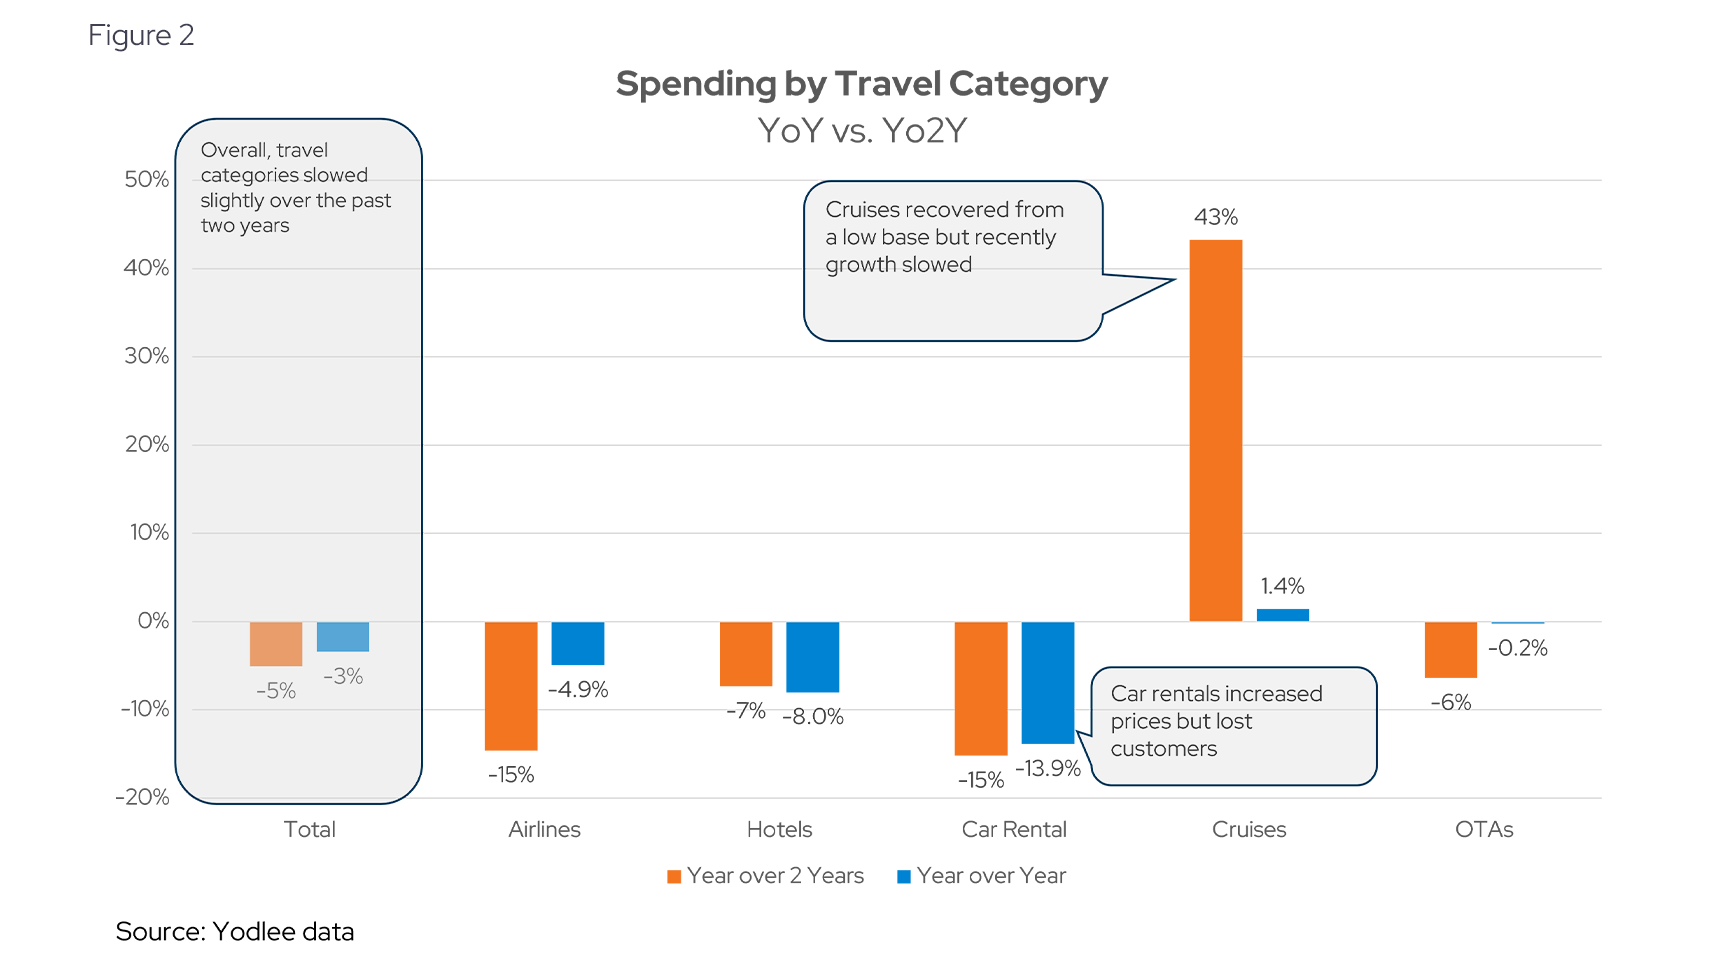
Breaking up total spending by category shows some variability in spending behavior, but the overall trend is still slightly down. As mentioned, total spending for our select group of companies slowed by 3% compared to the same time last year and is down 5% compared to the same time two years ago (Yo2Y). Airlines like American Airlines (AAL) and car rental companies like Avis (CAR) seem to be struggling the most, with car rental companies pulling in almost 14% less in May than the same time last year, despite growing their average order values (AOV). (Figure 3, see Avis). This slowdown may partially be caused by higher rental prices as well as increased gas prices.
Cruises offer a bright spot with positive, albeit tepid growth of 1.4% YoY, and a healthy bounce back from two years ago (43% Yo2Y). Although 1.4% is sluggish and may be a signal that cruise companies will not see a significant lift in bookings this year, they are still doing relatively well when compared to other pockets in travel and the consumer sector more broadly. It is important to note that cruises have an easier comparison number two years ago, as they were impacted by a slower COVID recovery than most other categories of travel. The other caveat is that cruises have grown spending by increasing prices rather than drawing new travelers (Figure 3). Cruises are evolving and offering more interesting experiences in a bid to attract customers, but this translates to higher prices that not everyone will be willing to pay. Keeping track of AOVs relative to customer counts will be important going forward.
AirBnB grows its lead in travel spending while hotels stagnate
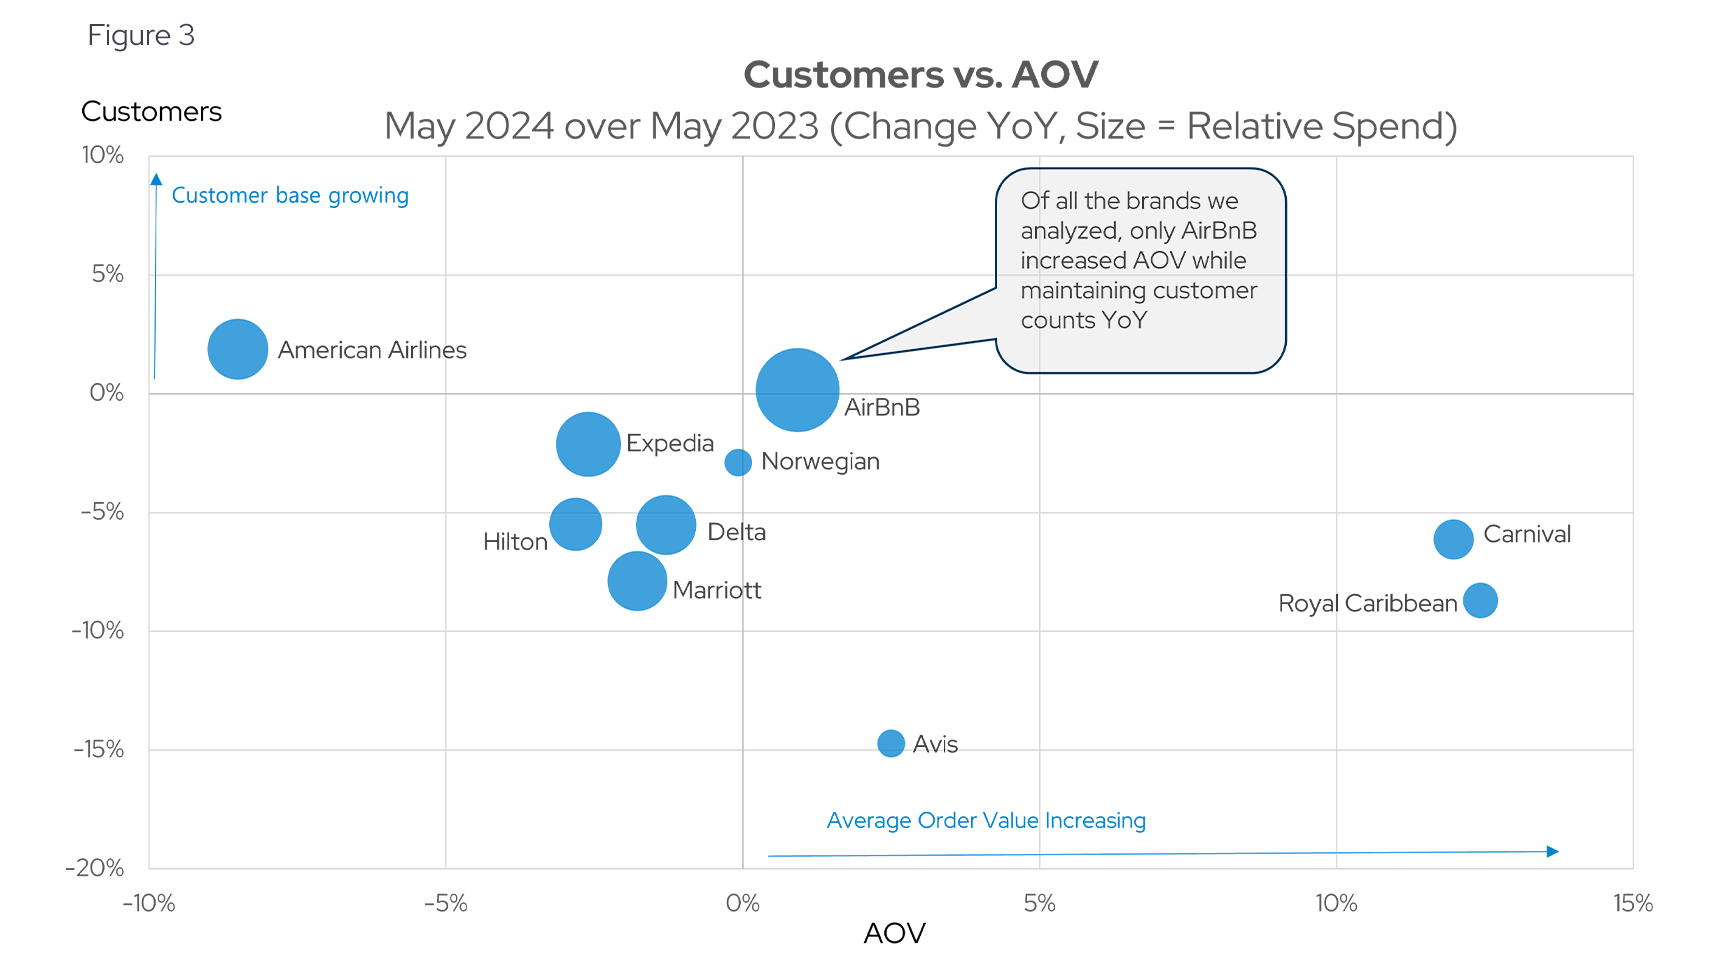
Figure 3 shows four quadrants, with the upper right representing companies that managed to grow their customer counts and simultaneously increase AOV. Only AirBnB (ABNB) managed to increase AOV and squeeze out a small gain in its customer base as some OTAs like Expedia (EXPE) remained flat to slightly down YoY. This shows AirBnB’s resilience and continued relevance to today’s vacationers. In cruises, Carnival (CCL) and Royal Caribbean (RCL) increased their AOVs by 10% since last year, but also experienced a 6% and 9% decline in customers, respectively. Norwegian (NCLH), which did not increase AOV, was able to keep a relatively stable customer base. (Figure 3)
Turning to the hotel industry, we analyzed Hilton (HLT) and Marriott (MAR). Both companies are in the lower left quadrant and are simultaneously showing a shrinking customer base and falling AOVs. The negative growth numbers are relatively small, nothing to cause any alarm. Instead, it can simply be viewed as a more cautious consumer making selective purchase decisions when booking their accommodations, with perhaps some of them opting for an AirBnB-type short-term rental.
Final thoughts: Travel well, but tread lightly
The travel sector is currently navigating a complex landscape shaped by uncertain economic conditions and changing consumer preferences – travelers are spending cautiously. While there are signs of recovery and resilience, particularly during peak travel seasons, the overall trend points to cautious consumer spending impacted by macroeconomic uncertainty. As we move forward, it will be crucial to monitor these trends closely, scrutinizing the spending data through year-end.
For investors, understanding these dynamics can provide valuable insights into the travel industry, helping them navigate changing consumer behaviors and economic conditions while investing with confidence and relying on data.
Want to see how transaction data can inform your investment process?
Learn more about Envestnet | Yodlee Merchant and Retail Insights and get a free demo from a sales representative.
About Envestnet Data & Analytics Income and Spending Trends
Envestnet Data & Analytics Income and Spending Trends utilize de-identified transaction data from a diverse and dynamic set of data from millions of accounts to identify patterns and context to inform spending and income trends. The trends reflect analysis and insights from the Envestnet | Yodlee data analysis team.