The proliferation of subscription services has revolutionized the way we purchase everything from the latest TV series to our weekly grocery haul. At the heart of this revolution on the consumer side lies the allure of convenience and in some cases, the pursuit of a curated experience. Personalized selections delivered directly to our doors have not just redefined luxury; they've made it an everyday affair.
Yet, as this transformative wave of purchasing takes shape, a more nuanced picture emerges. With the ever-growing array of subscriptions vying for a spot in the automatic payment lineup, many of us find ourselves entangled in services we scarcely use. Amidst rising inflation and a growing consciousness about financial health, some consumers are scrutinizing their subscription habits, aiming to distinguish indispensable services from those that are merely nice to have.
Dive into this blog to get a view of year-over-year trends, spend for top competitors and income insights across eight categories of subscription services. We are highlighting fitness, streaming, groceries, learning, clothing, gaming, beauty, and books as documented by Envestnet® | Yodlee®'s wealth of de-identified retail transaction data. And get a higher-level look at overarching subscription trends with our companion blog post on this topic.
Health and Fitness: Declining Subscriptions
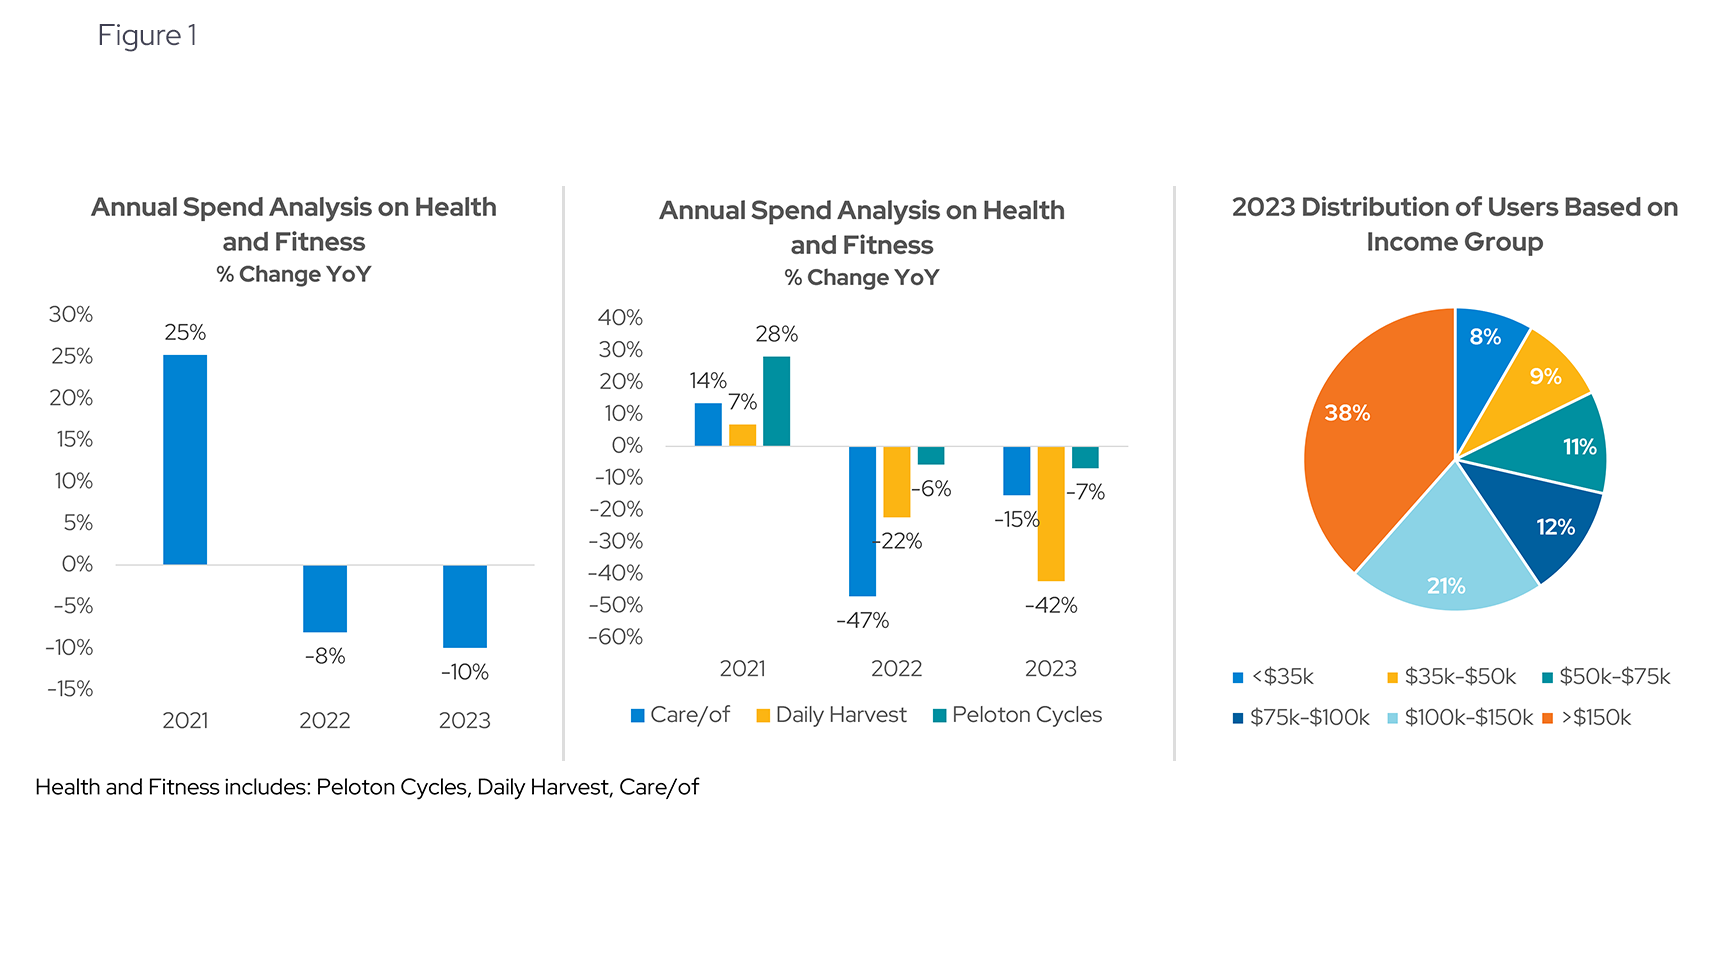
- Year-over-year trends: Health and fitness subscriptions surged during the pandemic as people kept up their gym habits with online workout classes and fitness app memberships. Yodlee data shows a 25% increase in health and fitness subscriptions from 2020 to 2021 (see Figure 1). As in-person experiences opened back up, the data shows a year-over-year decrease in spending between 2021-2022 (8% decrease) and 2022-2023 (10% decrease).
- Income insights: Unsurprisingly, the higher the income level, the more users subscribe to health and fitness services. Those with the highest income are the largest percentage of users (38%), while the lowest income are the smallest percentage of users (8%).
Streaming Services: Increasing Subscriptions
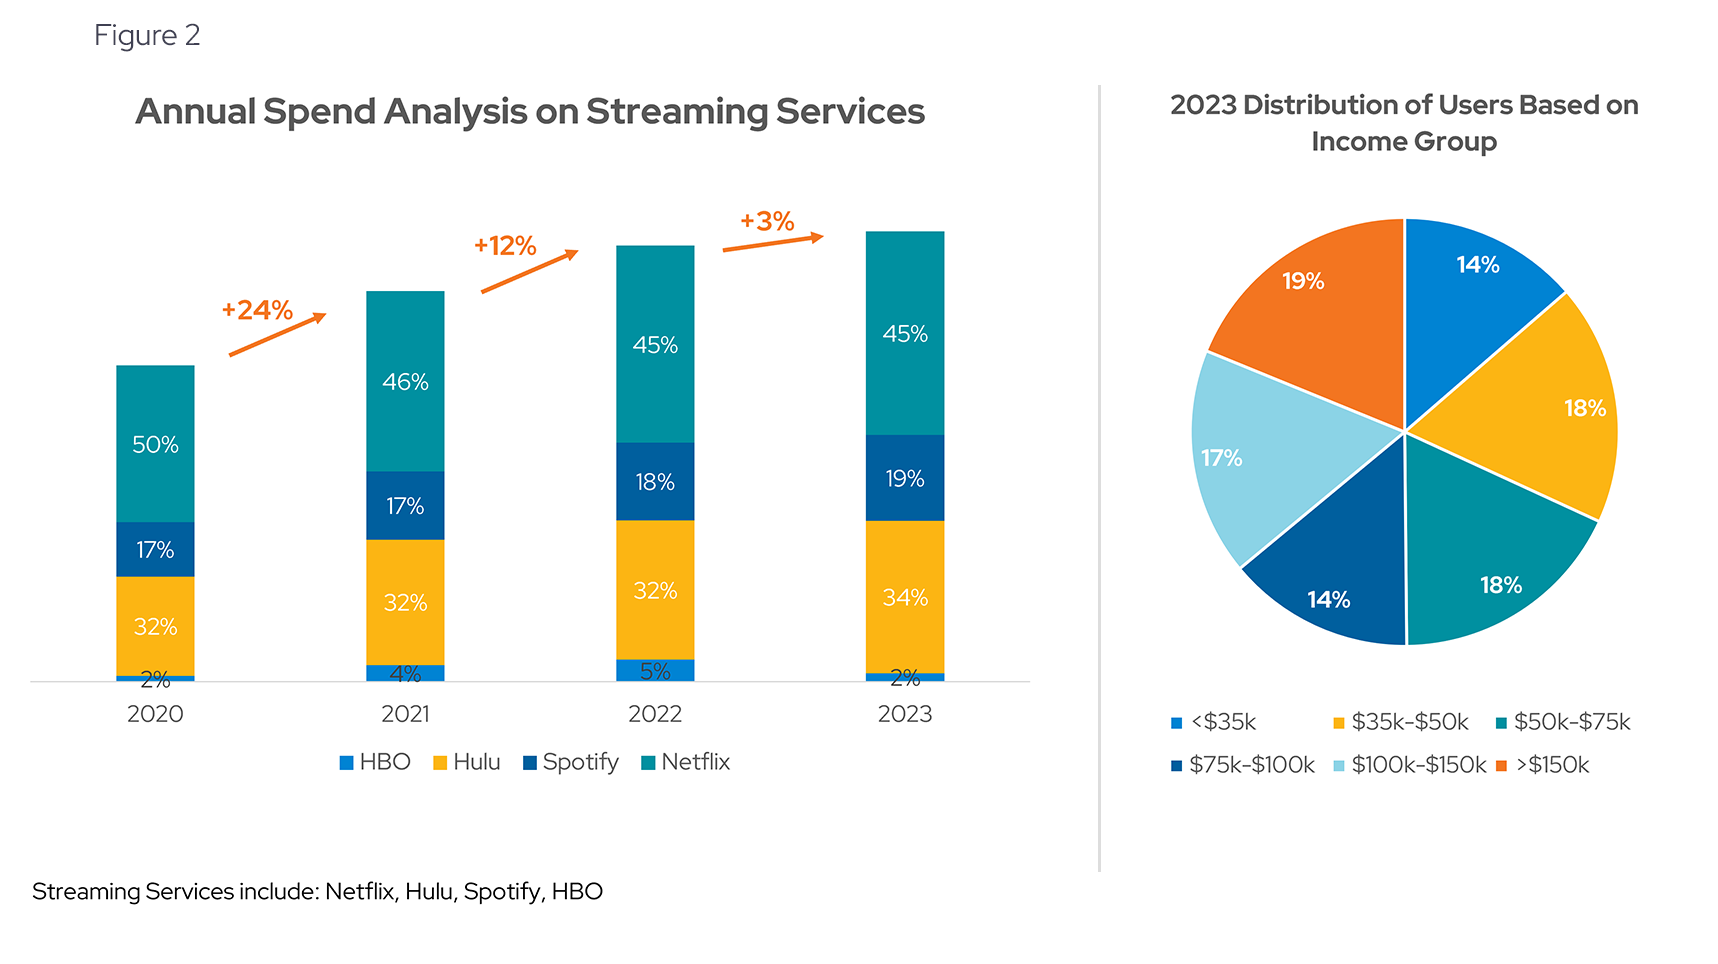
- Year-over-year trends: Yodlee data suggests that subscriptions to streaming services have increased year-over-year for the past three years (from 2020 to 2023) (see Figure 2). We saw the biggest jump (24% increase) occur between 2020 to 2021 when we were all sitting on our couches, desperate for entertainment. That increased another 12% between 2021 and 2022. Growth moderated between 2022 and 2023 but was still on the rise.
- Competitors: Netflix, the incumbent in the streaming space, has a larger percentage of spend than its competitors HBO, Hulu and Spotify. While Netflix maintains a lead, percentage of spend has gone down from 50% in 2020 to 45% in 2023 as competitors woo viewers with interesting content and bundled packages.
- Income insights: The data shows a fairly even distribution of streaming service subscribers among income demographics. The highest income group of >$150k made up 18% of users and the lowest income group of <$35k made up 14% of users.
Check our recent in-depth review of streaming services: The future of streaming: Insights and trends shaping the digital media landscape
Meal Kits and Grocery Delivery: Declining Subscriptions
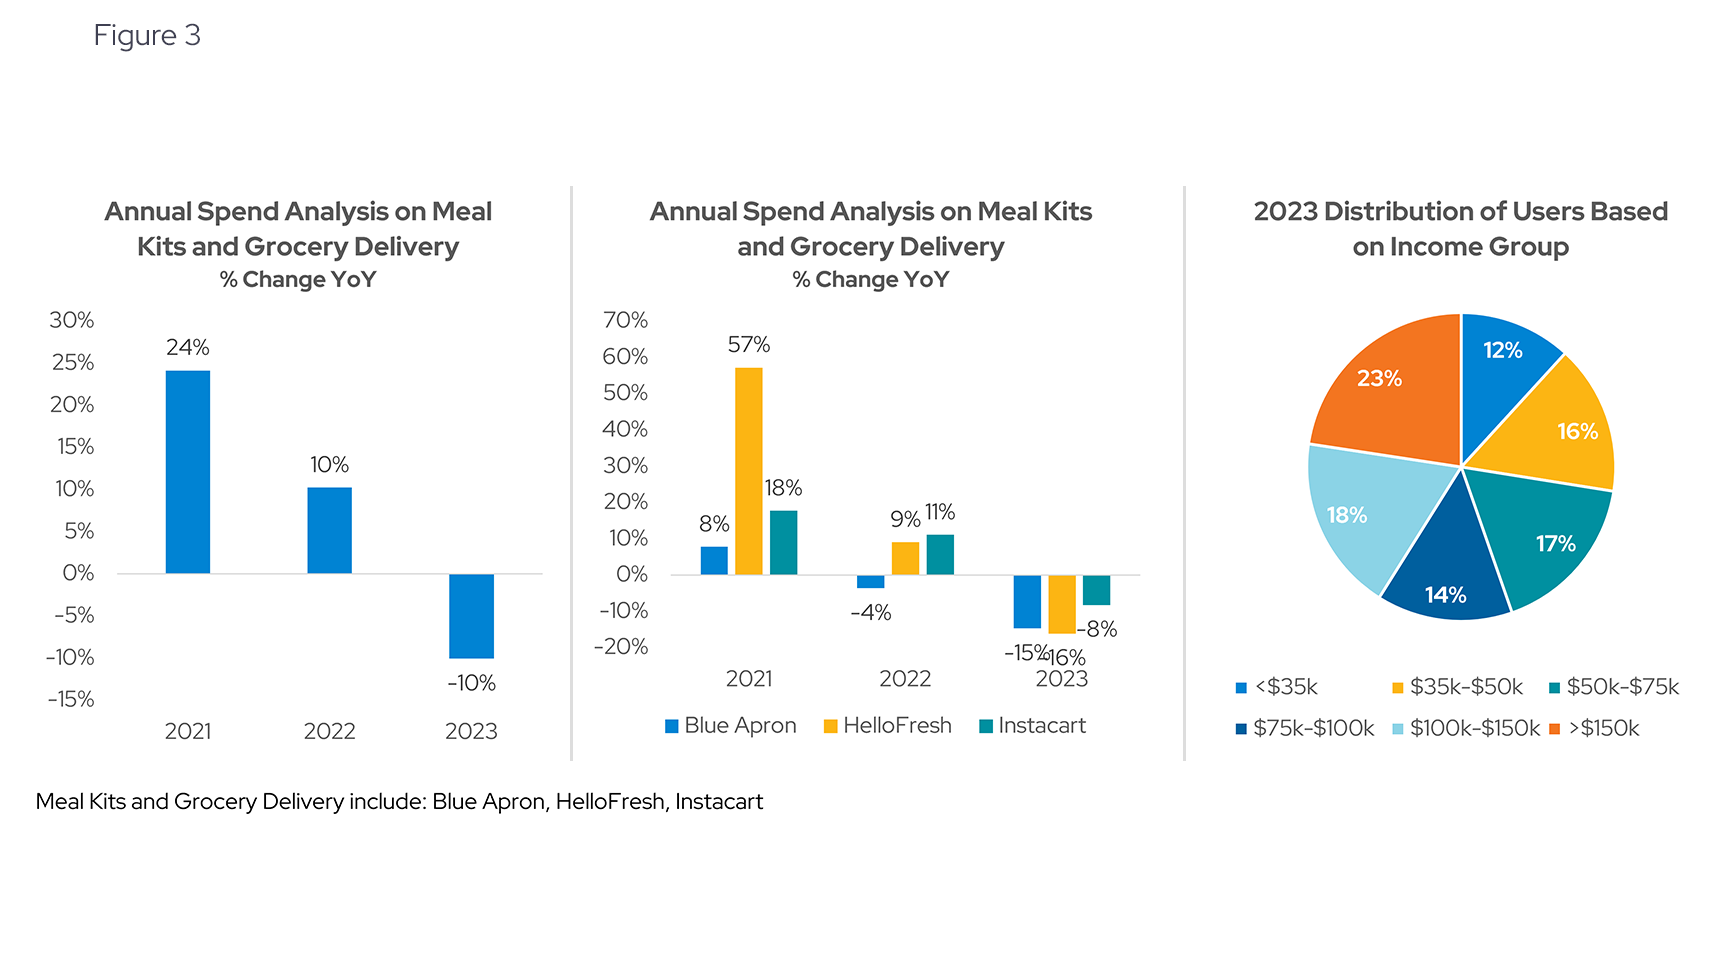
- Year-over-year trends: The pandemic likely contributed to the rise of the meal kit and grocery delivery market. Given the need to “shelter in place”, consumers were more likely to cook at home and have their groceries delivered. Yodlee data aligns with this theory. In Figure 3, the data shows a year-over-year increase of 24% in meal kits and grocery delivery subscriptions between 2020-2021. There was an additional 10% increase between 2021-2022. As consumers became more comfortable with meeting friends and going to restaurants, demand for these services subsided, resulting in a 10% drop between 2022 and 2023.
- Income insights: The data shows a usage disparity between the highest (>$150k) and lowest (<$35k) income groups, with the former (23%) nearly double in number compared to the latter (12%).
Online Learning Platforms: Increasing Subscriptions
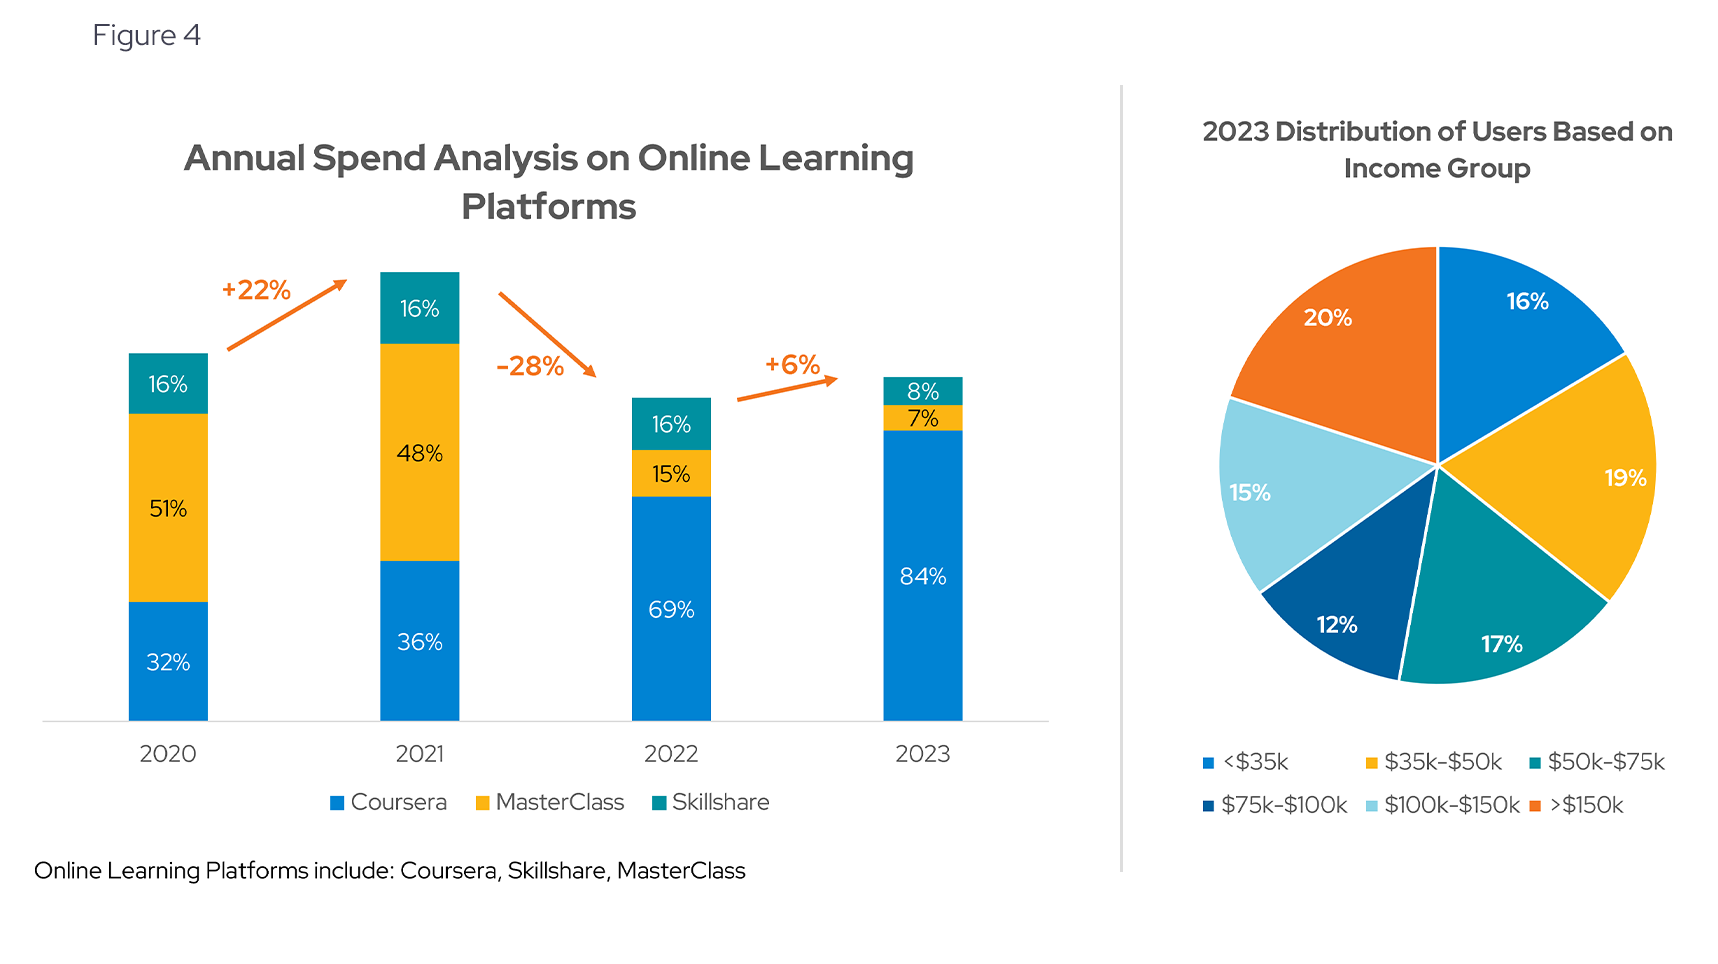
- Year-over-year trends: It’s possible that numerous people took advantage of the downtime during the pandemic to study up. Online learning subscriptions increased 22% between 2020-2021. That uptick dropped by 28% between 2021-2022 (see Figure 4). There was a an uptick 6% between 2022-2023.
- Competitors: Looking across Coursera, Skillshare and MasterClass, Coursera emerged as the undisputed leader in online learning expenditure, more than doubling spend from 23% in 2020 to 84% in 2023. Coursera's surge could be attributed to its online courses and degrees offered in partnership with top universities.
- Income insights: Spend appears to be relatively consistent across incomes.
Clothing and Fashion: Declining Subscriptions
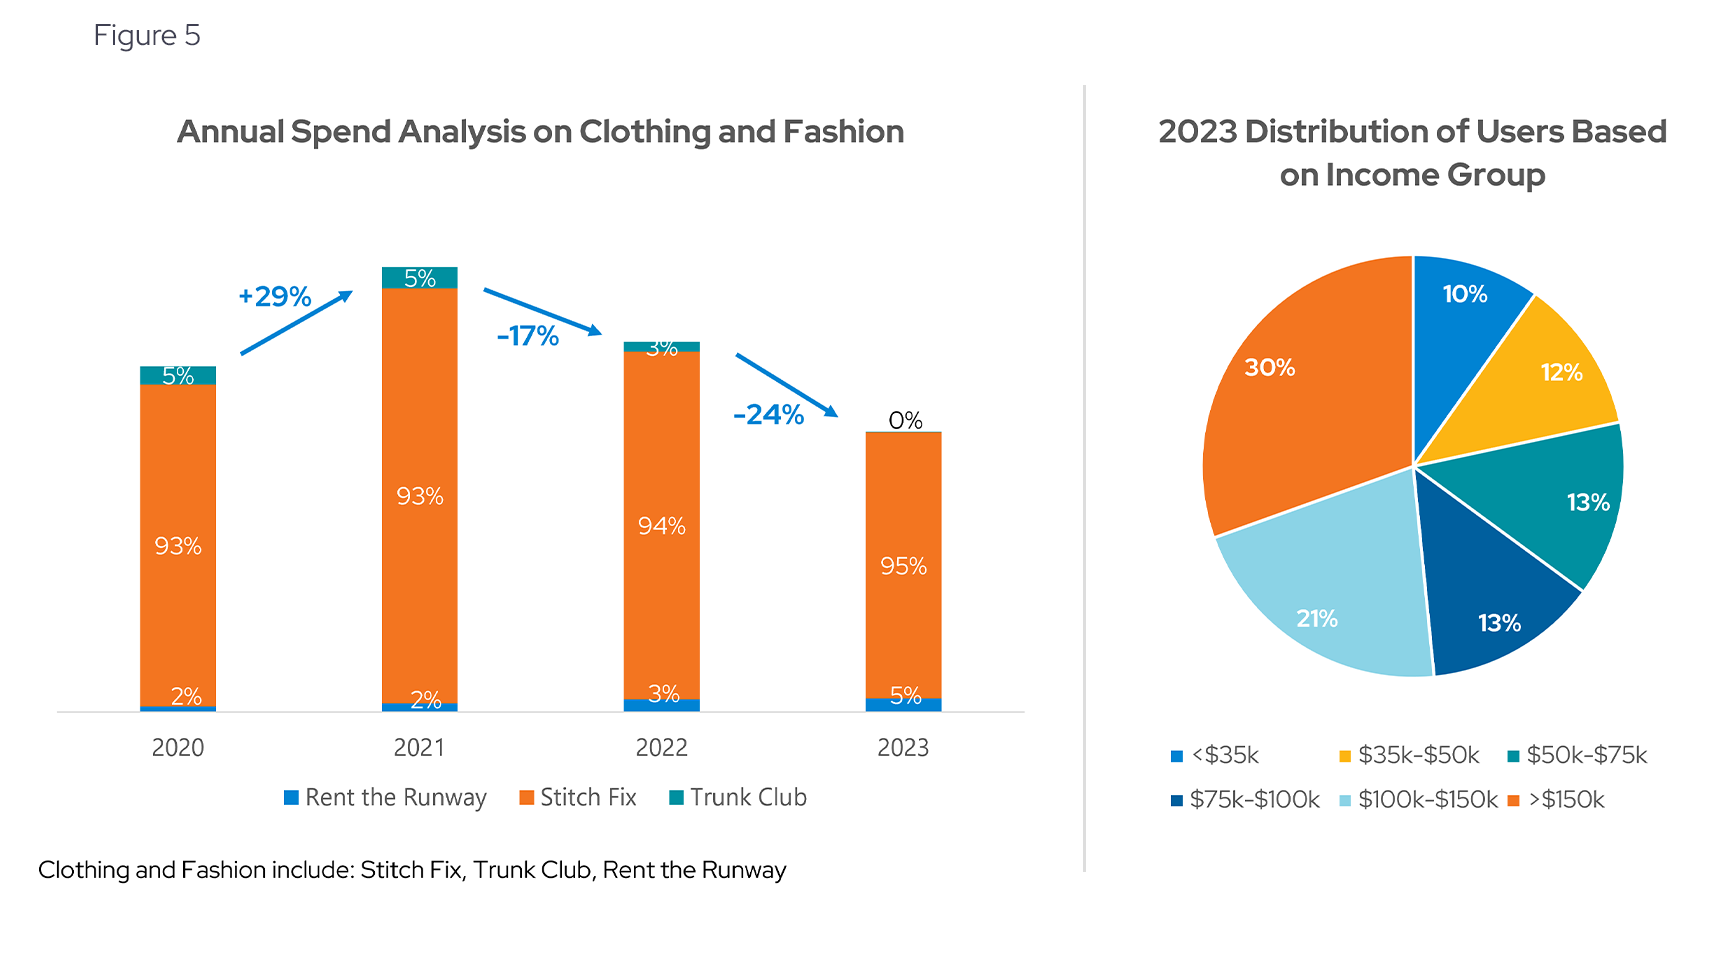
- Year-over-year trends: Spending on clothing and fashion subscriptions increased significantly (+29%) between 2020-2021 (see Figure 5). This was followed by two years of spending declines. It’s possible that the initial uplift can be attributed to the pandemic-induced shift in consumer behavior towards online shopping. The subsequent decline may reflect a market correction as consumers returned to in person shopping as well as financial considers of the monthly cost.
- Competitors: Stitch Fix has maintained spend dominance from 2020-2023 when compared to Rent the Runway and Trunk Club.
- Income insights: There is high usage disparity between the highest income group (>$150k) and the lowest income group (<$35k), with the former (30%) triple the number compared to the latter (10%).
Gaming Services: Declining Subscriptions
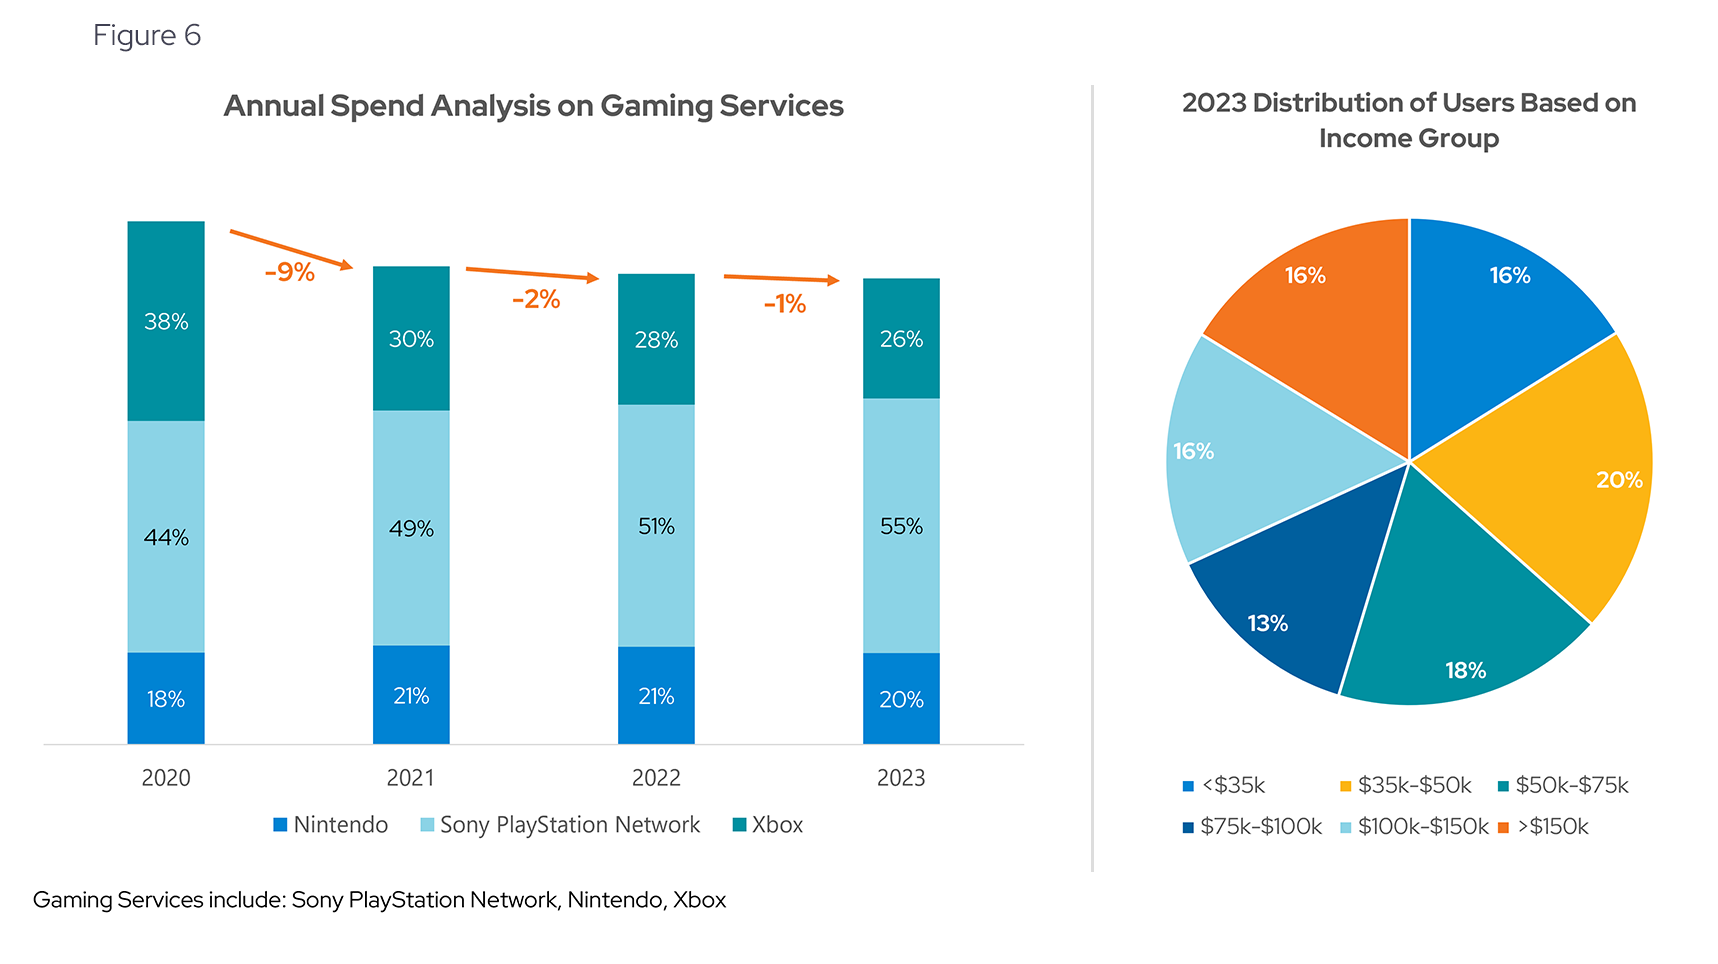
- Year-over-year trends: The data appears to show year over year declines in gaming subscriptions between 2020-2023, though decreases have been moderate for the past two year-over-year periods (see Figure 6). The decline could be attributed to a combination of market saturation, with an overwhelming choice of platforms leading to decision fatigue among consumers, and a normalization of gaming habits as the world began to reopen post-pandemic.
- Competitors: Sony PlayStation appears to have outpaced Nintendo and Xbox in the 2020-2023 period.
- Income insights: Gaming subscription usage by income is fairly even across levels, with the exception of a higher percentage (20%) from users earning $35k-$50k.
Beauty and Personal Care: Declining Subscriptions
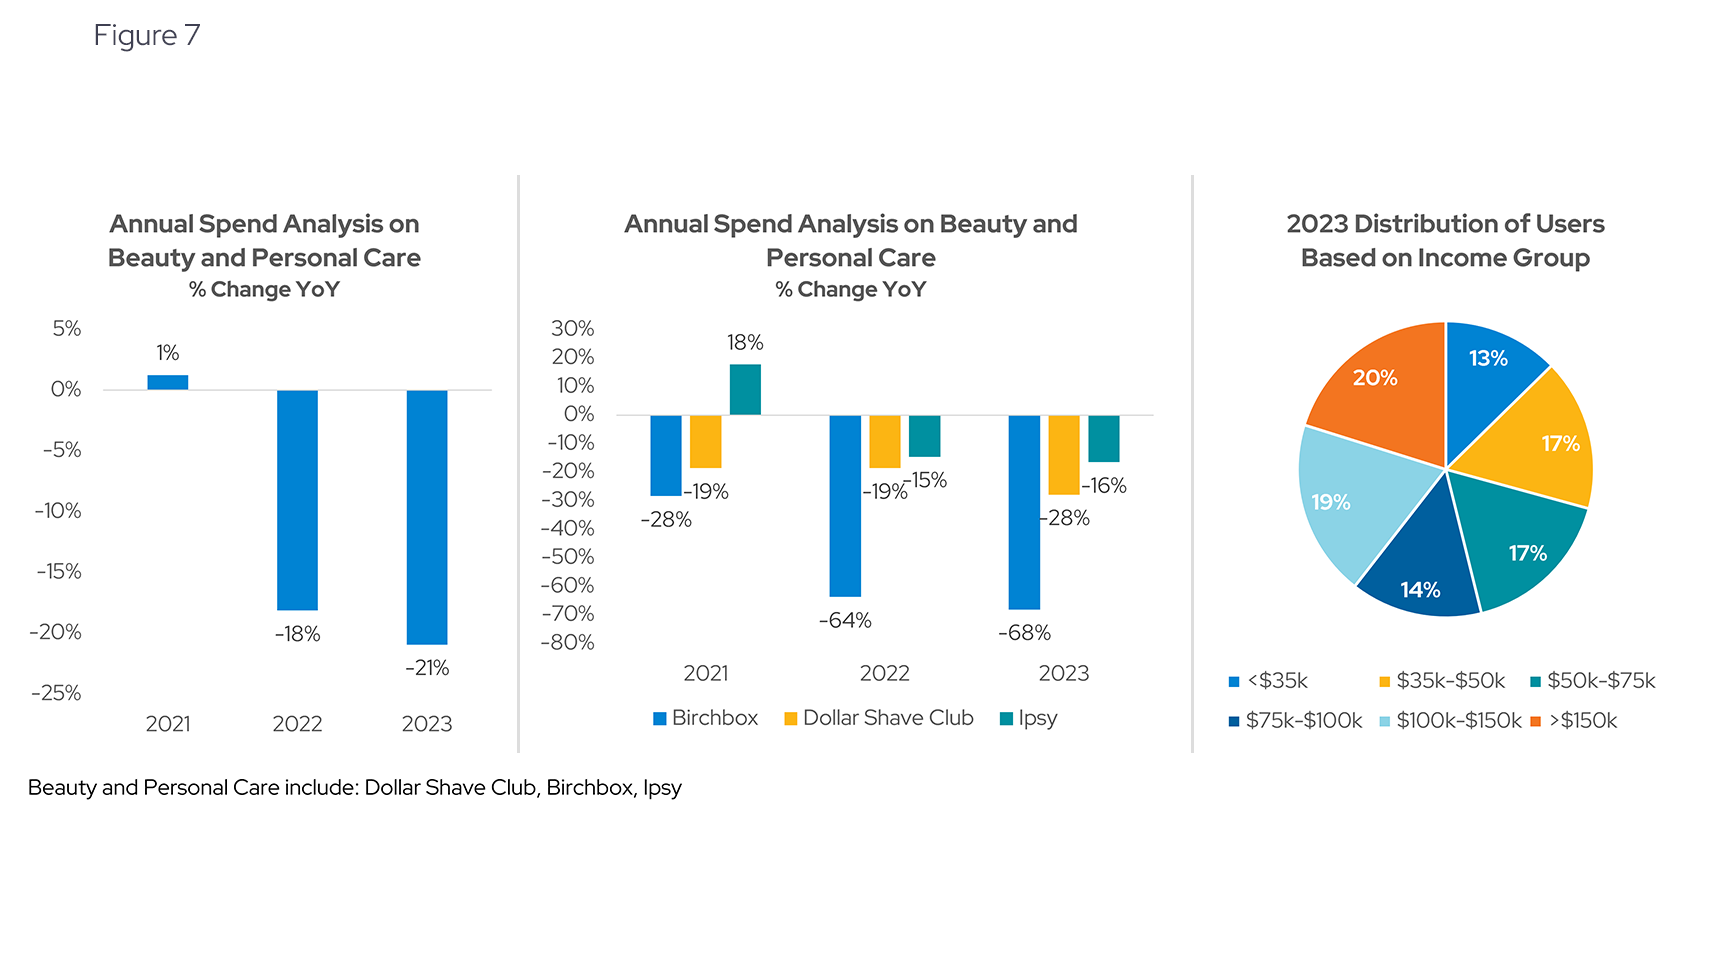
- Year-over-year trends: While spending on beauty and personal care subscriptions grew moderately from 2020-2021, spend on this category took sharp year-over-year declines over the following two year-over-year periods (see Figure 7). The decrease could be attributed to a combination of subscription fatigue, inflationary pressures and oversaturation of options.
- Income insights: The two highest income levels (>$150k and $100k-$150k) show the highest percentage of users in this category, with 20% and 19% respectively.
Audiobooks and Reading: Increasing Subscriptions
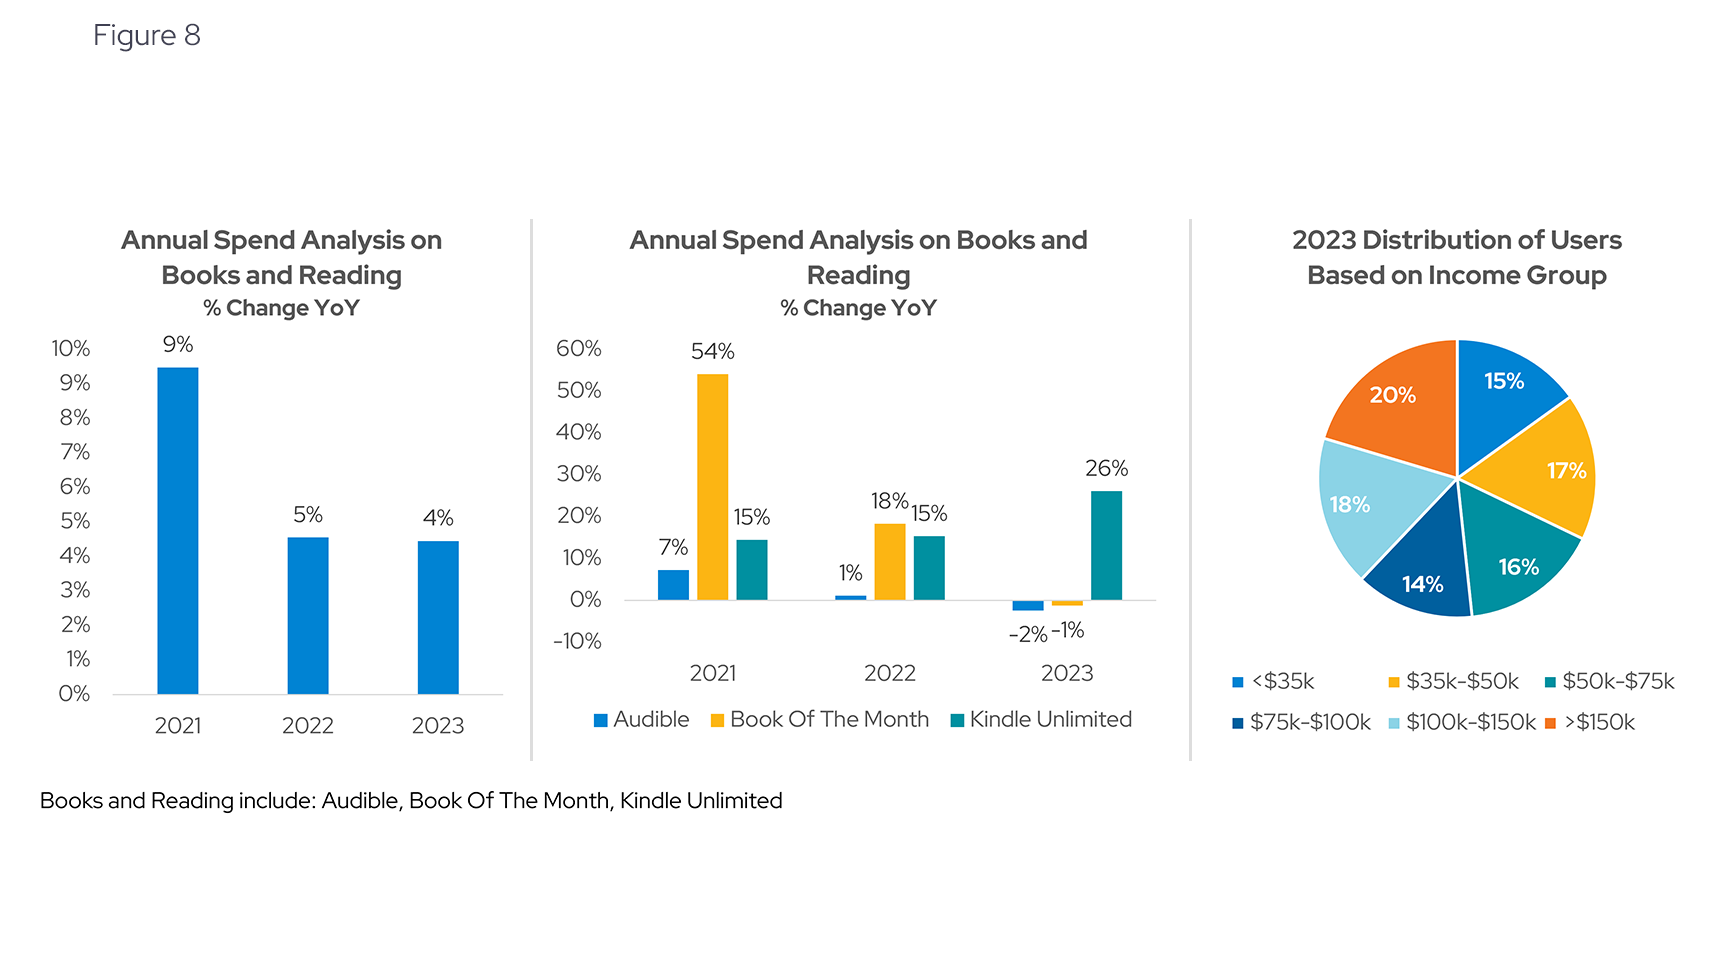
- Year-over-year trends: Book (audio, electronic and paper) subscriptions were positive year-over-year between 2020-2023, with the highest increase happening between 2020-2021 (+9%) (see Figure 8).
- Income insights: The data shows no obvious trends in usage by income. The highest income group also has the highest percentage of usage (20%) while the lowest income group has 15%.
Want to get ahead of consumer spending trends?
Subscribe to our research data blog for ongoing updates or reach out for a personalized, up-to-date view of Yodlee consumer spending data.
About Envestnet | Yodlee Merchant, Retail, Shopper, and Spend Insights
Envestnet | Yodlee Merchant, Retail, Shopper, and Spend Insights utilize de-identified transaction data from a diverse and dynamic set of data from millions of accounts to identify patterns and context to inform spending and income trends. The trends reflect analysis and insights from the Envestnet | Yodlee data analysis team. By combining data with intelligence – connecting vast amounts of actual de-identified shopping data with state-of-the-art analytics and machine learning – Envestnet | Yodlee provides visibility into a large set of shopping daily purchase behavior including, but not limited to, transactions, customer lifetime values, and merchant/retailer shares.
To learn more about Envestnet | Yodlee Merchant and Retail Insights and get a free demo, please contact an Envestnet | Yodlee sales representative.