Since the onset of the pandemic, Envestnet | Yodlee has been regularly tracking spending trends in several key consumer sectors in the United States to see how they are uniquely affected by the current economic environment. We have also been monitoring trends within various income groups that have been impacted over the past several months and how spending priorities and patterns have changed.
This week we launched an interactive map which allows a view into the national and regional impacts of COVID-19, comparing targeted trends in these key categories on a weekly and monthly basis versus the prior year.
We have aggregated the information into six major industry sectors for which we believe it is important to track.
- Retail – Consumer retail, other than food and staples, such as clothing
- Discretionary – All types of discretionary categories including electronics, entertainment, home improvement, etc.
- Food delivery – Independent food/grocery delivery service providers
- Food & staples – Hypermarkets, grocery stores, etc.
- Restaurants – Dine-in restaurants
- Transportation – Merchants that provide transportation services via air, road or rail.
Throughout the pandemic, we’ve written blogs that have displayed closer looks at the trends.
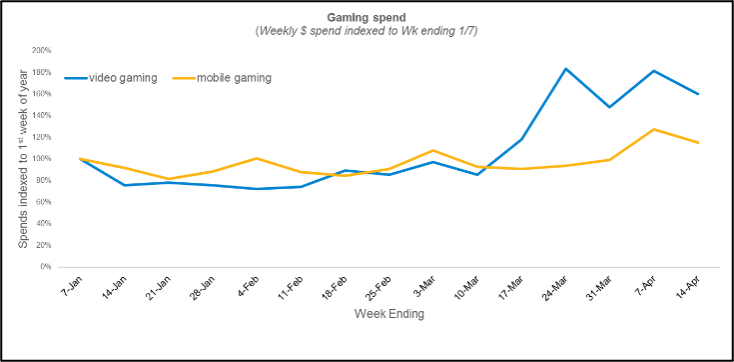
For example, in April, we looked at trends related to entertainment spending as shelter-in place orders were first instituted. Envestnet | Yodlee spending trends data showed a spike in spending on video games. This occurred in tandem with a sharp decline in spending on traditional entertainment, like going out to the movies.
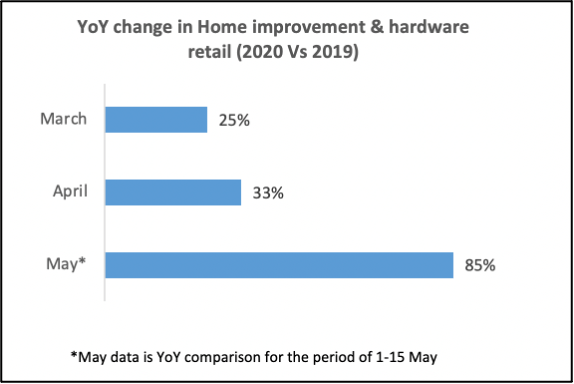
In June, we looked at how home improvement and hardware stores fared during the first few months of the shelter-in-place orders. Transactions at these types of stores grew in April and May, significantly outpacing the same months in 2019. Whether or not the increase in spending is a result of Americans taking on home improvement projects during the pandemic is up to interpretation. However, the data is clear: spending on home improve and hardware has risen significantly.
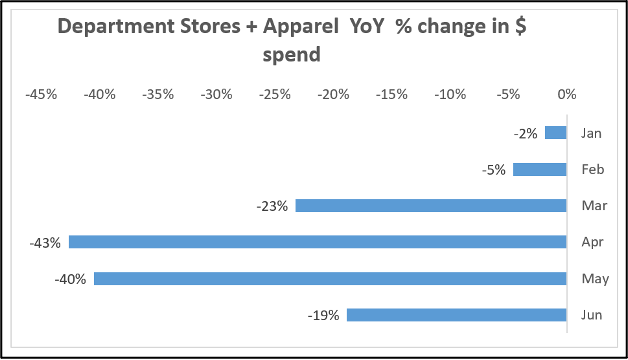
Later on in the summer, we looked at how shopping malls, traditional retail powerhouses for the American shopping culture, were affected by the pandemic. Our analysis showed that brick and mortar department stores (clothiers, luxery goods, fashion, etc.) indicated the severity of the decline occurring most in April and May. These numbers backed up widely held conclusions that many merchants were unprepared for the change in consumer spending habits that ensued after the pandemic hit.
These insights and analytics can be a very powerful tool in decision-making for businesses, individuals and the government to make informed decisions toward helping us all navigate through this crisis. For more information, please visit our COVID-19 Income and Spending Trends homepage
Metrics have been generated based on customer permissioned de-identified transaction data and may not reflect the U.S. census population distribution. Data is provided for informational purposes only.